📊 Experiments & Results
Evaluation Setup
Tabular classification on clinical and socioeconomic datasets.
Benchmarks:
- ACS Income (Income prediction (binary))
- HMDA Mortgage (Mortgage approval prediction)
- Clinical Datasets (Heart, Stroke, Diabetes, etc.) (Disease risk prediction)
Metrics:
- Test Error (Accuracy/Risk)
- Data Use (Average number of attributes reported per user)
- Percentage of groups suffering worsenalization
- Statistical methodology: Bootstrap resampling (100 trials) to generate confidence intervals (shaded regions in plots).
Key Results
| Benchmark | Metric | Baseline | This Paper | Δ |
|---|---|---|---|---|
| Average across 6 clinical datasets | % Groups Worsenalized | 33.0 | 0.0 | -33.0 |
| ACS Income (CA) | Error Rate | 0.225 | 0.220 | -0.005 |
| ACS Income (CA) | Attributes Reported | 2.0 | 0.8 | -1.2 |
| Heart Failure | Error Rate | 0.18 | 0.16 | -0.02 |
Experiment Figures
Pareto plots of Test Error (y-axis) vs. Average attributes reported (x-axis) for ACS Income across different states.
Comparison of 'Worsenalization' (negative gains) across clinical datasets.
Main Takeaways
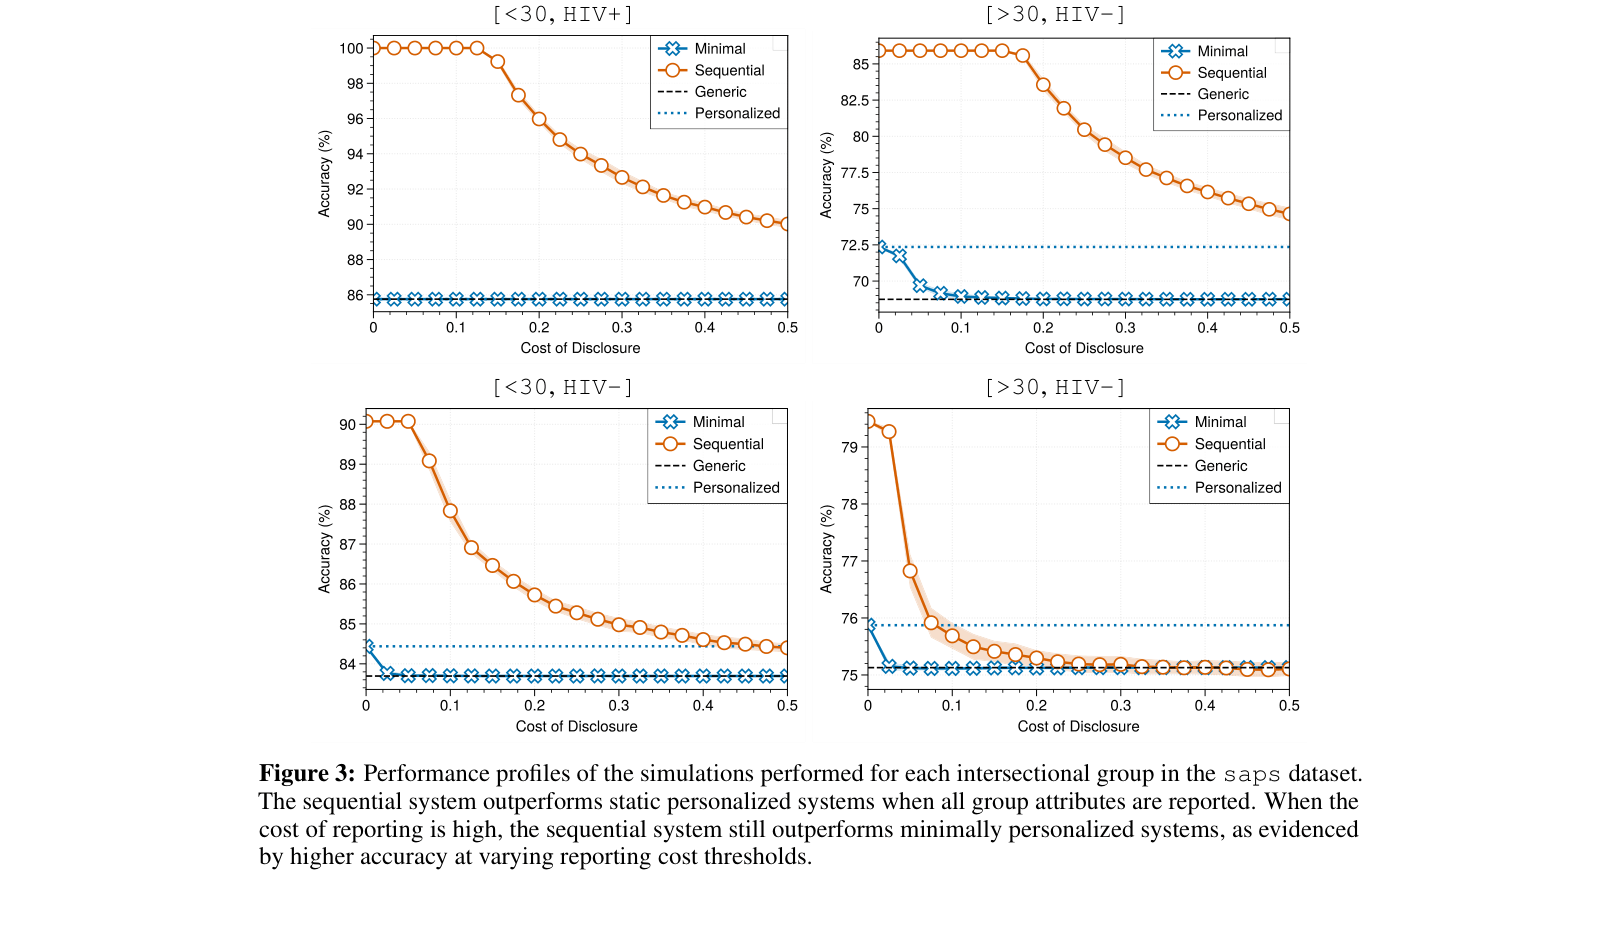
- Participatory systems consistently lie on the Pareto frontier of Accuracy vs. Data Use, often outperforming methods that use all data by selectively discarding 'harmful' personalization.
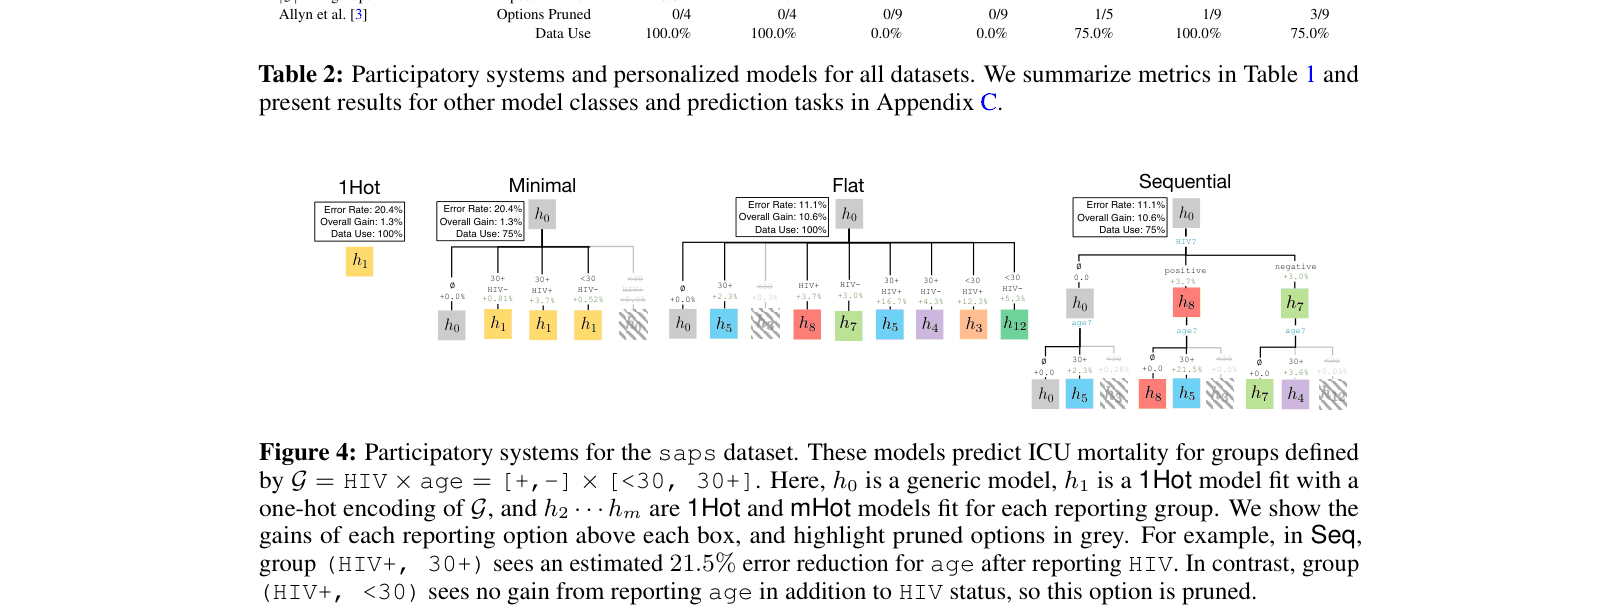
- The 'Sequential' interface type typically offers the best trade-off, querying only the most predictive attributes first.
- Imputation methods (Mean, MICE) often fail to recover the performance of true data and can perform worse than simple generic models in this context.
- The approach is robust to the number of available group attributes, showing gains even with just 2-3 sensitive features.