📝 Paper Summary
Agentic AI
Tool Use
Benchmarks
MCPAgentBench evaluates LLM agents on local, authentic Model Context Protocol (MCP) tasks, focusing on execution efficiency and robustness against distractors rather than just correctness.
Core Problem
Existing MCP benchmarks rely on unstable remote servers, lack granular difficulty awareness, and focus primarily on correctness, ignoring the execution efficiency (time and token cost) of agentic workflows.
Why it matters:
- Dependency on remote MCP servers causes instability and poor reproducibility in benchmarks
- Current evaluations fail to measure resource waste (excess tokens/time) even when tasks are completed correctly
- Models need to be tested on their ability to select the right tools from large, distractor-filled lists, mimicking real-world 'needle in a haystack' scenarios
Concrete Example:
A model might correctly solve a task requiring two parallel searches. However, instead of calling them concurrently (parallel), it calls them one by one (serial), doubling execution time and token usage. Existing benchmarks score this as 'correct', missing the inefficiency.
Key Novelty
Efficiency-Centric Local MCP Benchmark
- Reconstructs real-world MCP tools as local Python mock code to ensure deterministic, stable evaluation without remote server dependencies
- Introduces 'Task Efficiency Finish Score' (TEFS) to penalize agents that solve tasks correctly but use inefficient strategies (e.g., serializing parallelizable sub-tasks)
- Dynamic sandbox environment that injects distractors (unrelated tools) into the candidate list to test tool discrimination robustness
Architecture
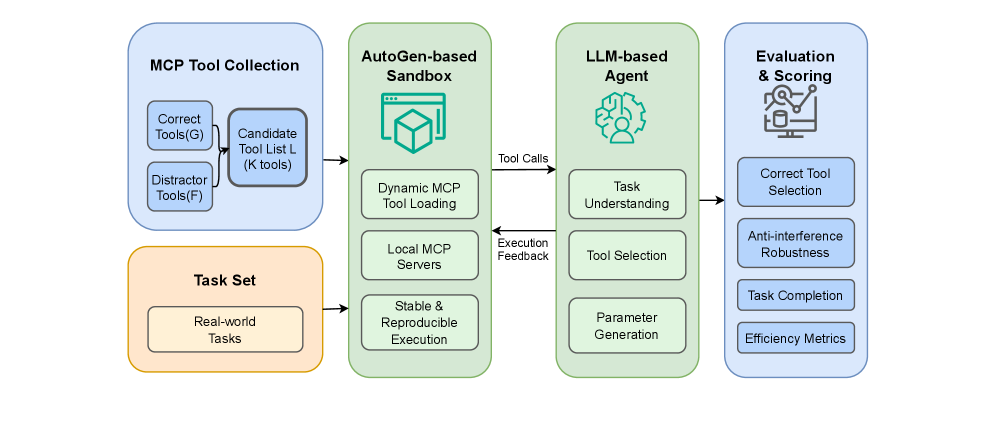
The overall architecture of MCPAgentBench, including data collection, the sandbox environment, and the evaluation loop.
Evaluation Highlights
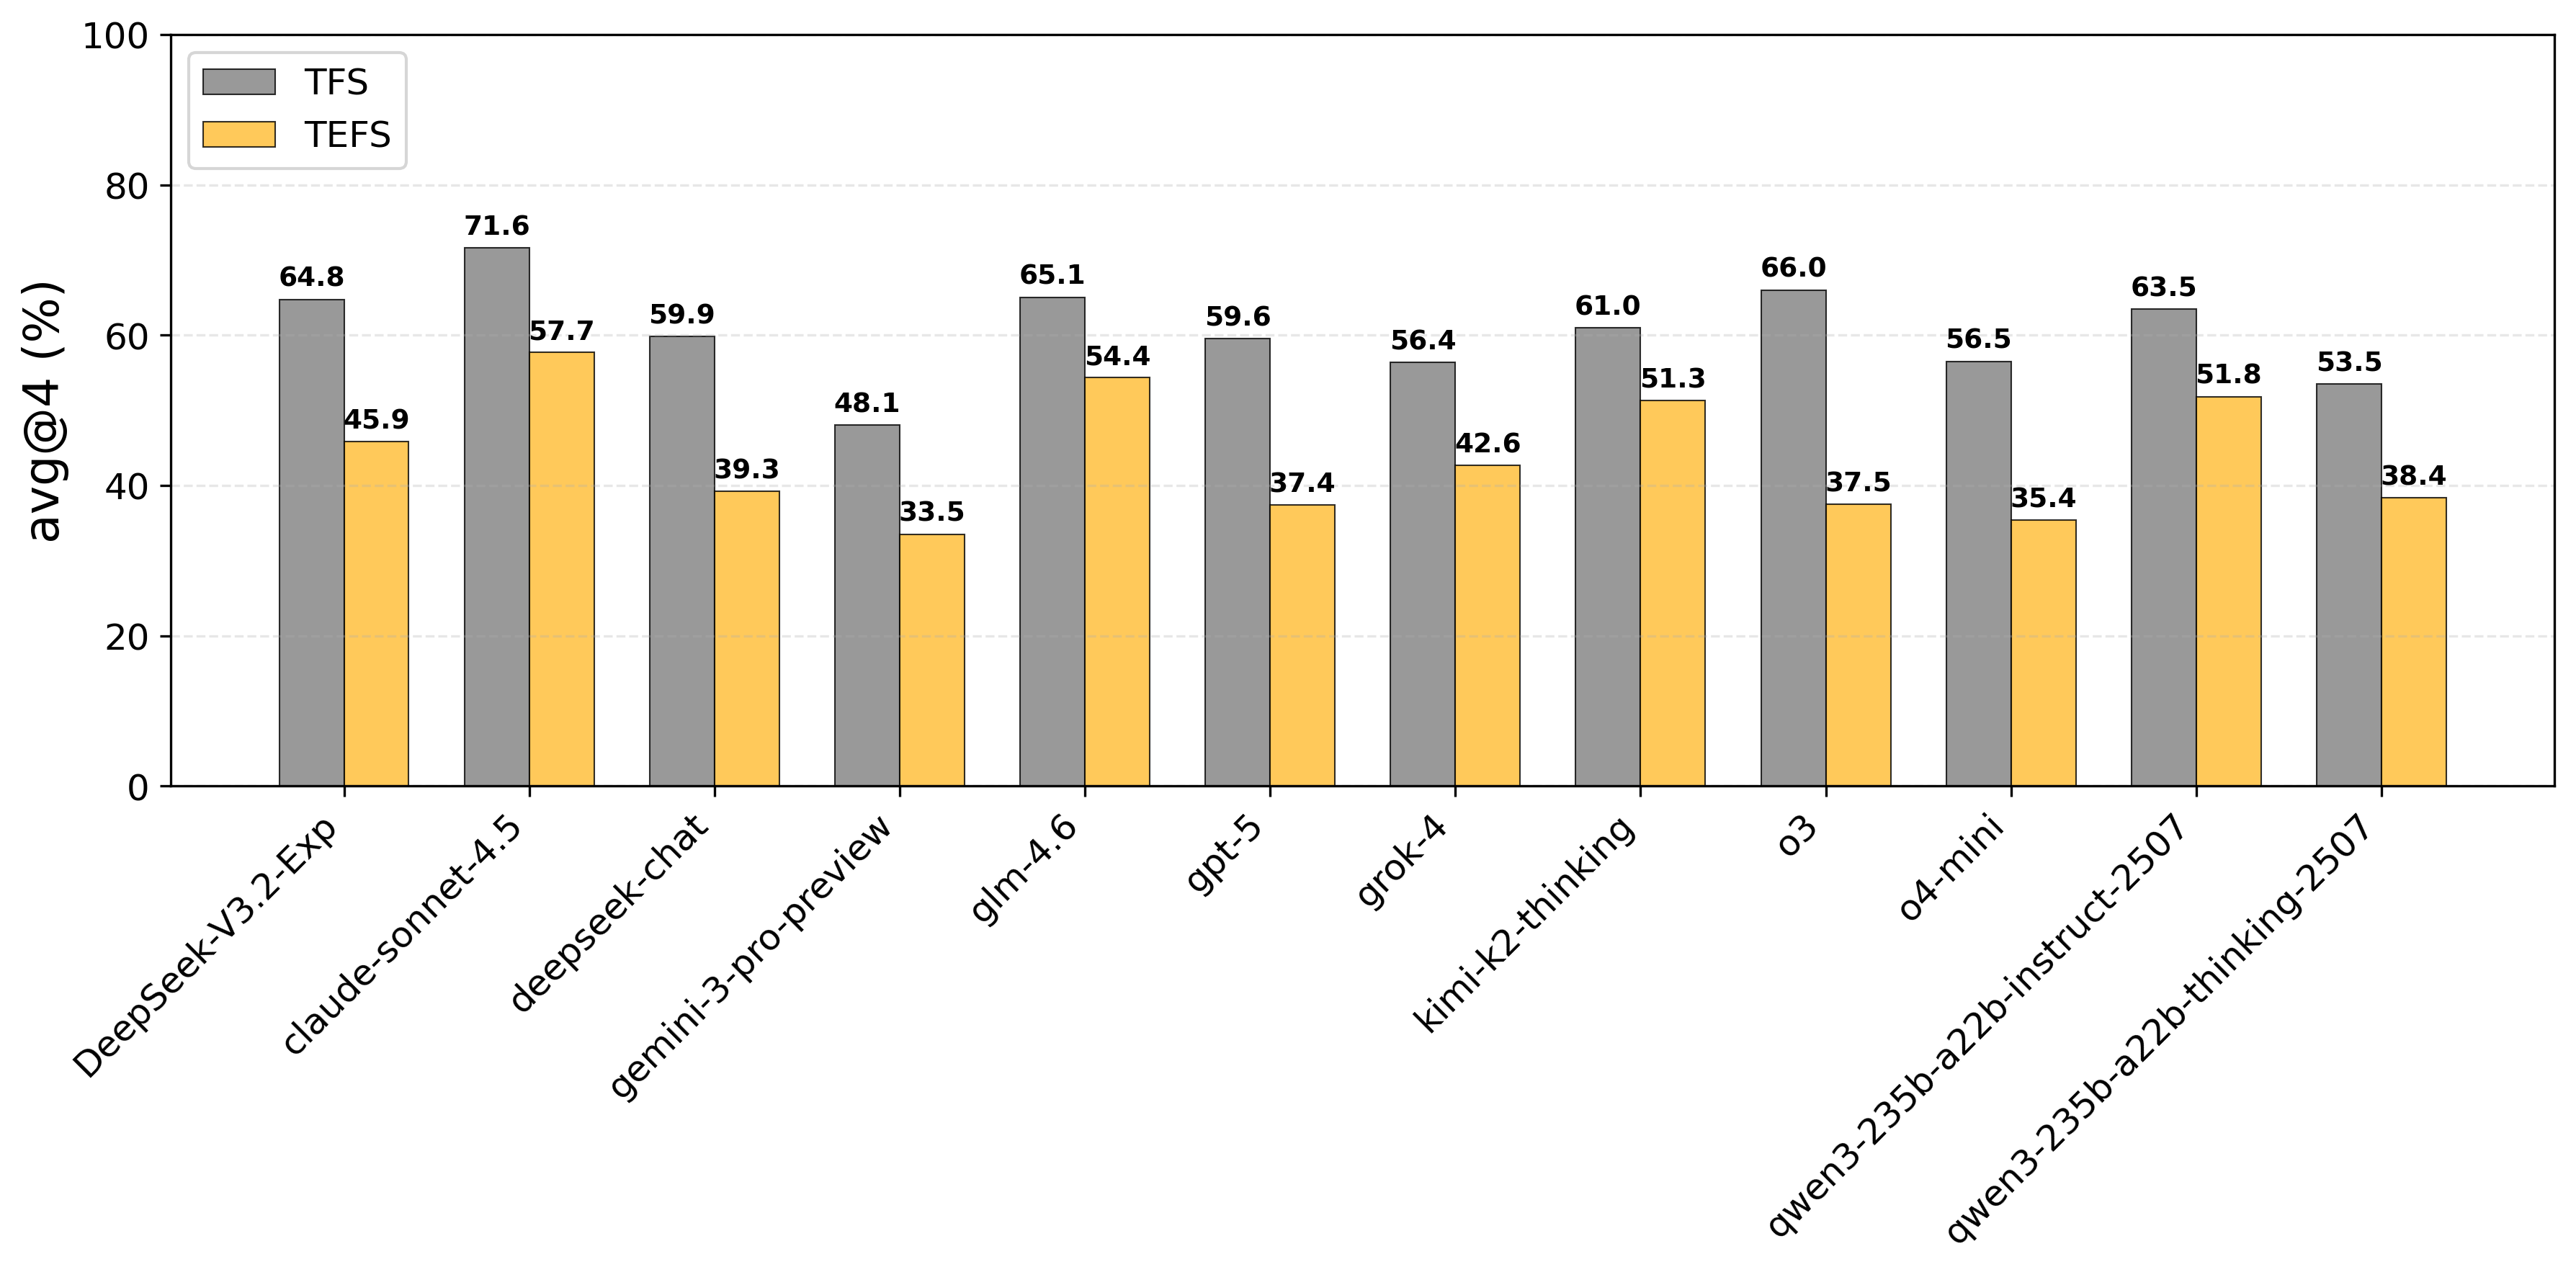
- Claude Sonnet 4.5 achieves the highest efficiency score (57.7 TEFS), outperforming the next best model (glm-4.6) by +3.3 points
- OpenAI models (e.g., gpt-5) score 0 on Dual Parallel tasks under the efficiency metric (TEFS) because they default to extreme serial execution despite solving the task correctly
- Efficiency penalty is significant: gpt-o3 sees a massive 28.5 point drop when moving from correctness score (TFS) to efficiency score (TEFS)
Breakthrough Assessment
8/10
Significant contribution by standardizing local MCP evaluation and exposing the 'correct but inefficient' failure mode of current SOTA models, particularly regarding parallel execution.