📝 Paper Summary
Self-evolving Agentic reasoning
RL-based tool use
A reinforcement learning framework that jointly trains a designer policy to create goal-specific tools and a controller policy to use them, enabling robots to solve manipulation tasks by prototyping tools on the fly.
Core Problem
Existing methods for co-optimizing agent morphology and control typically output a single static design for a generic task, failing to adapt to specific, varying task goals (e.g., reaching different locations).
Why it matters:
- Robots in unstructured environments (like homes) encounter diverse tasks where no single tool is optimal, requiring adaptability
- Current approaches using stochastic optimization (like CMA-ES) are sample-inefficient and must re-optimize from scratch for every new goal
- Real-world constraints often require trading off material cost against energy usage, which static designs cannot dynamically address
Concrete Example:
In a 'Fetch Cube' task, a robot needs to retrieve an object from under an overhang. If the object is far away, it needs a long hook; if close, a short hook suffices. A standard optimizer would find one 'average' hook that might fail at extremes or waste material, whereas this approach generates a specific hook length based on the target distance.
Key Novelty
Goal-Conditioned Joint Design and Control Policies
- Treat tool creation as a 'design phase' in an MDP, where a policy outputs design parameters (e.g., link lengths) based on the specific goal
- Train a separate controller policy that takes the generated design and task state as input to execute the manipulation
- Introduce an auxiliary reward term to trade off design complexity (material use) vs. control effort (velocity), adjustable via a single hyperparameter
Architecture
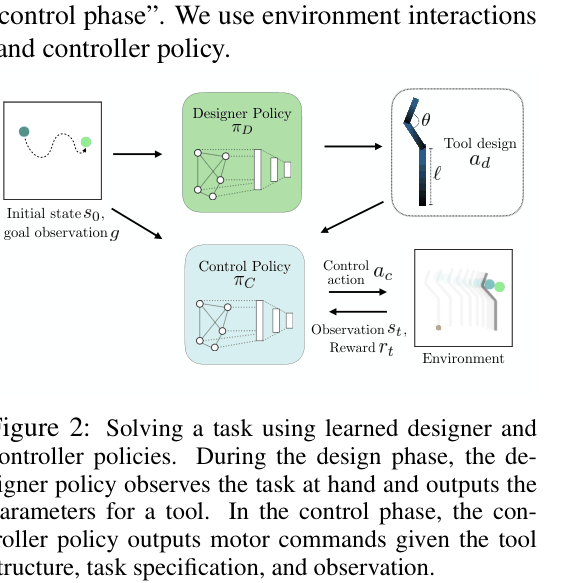
The two-phase MDP formulation and policy flow. Design Phase (top) -> Control Phase (bottom).
Evaluation Highlights
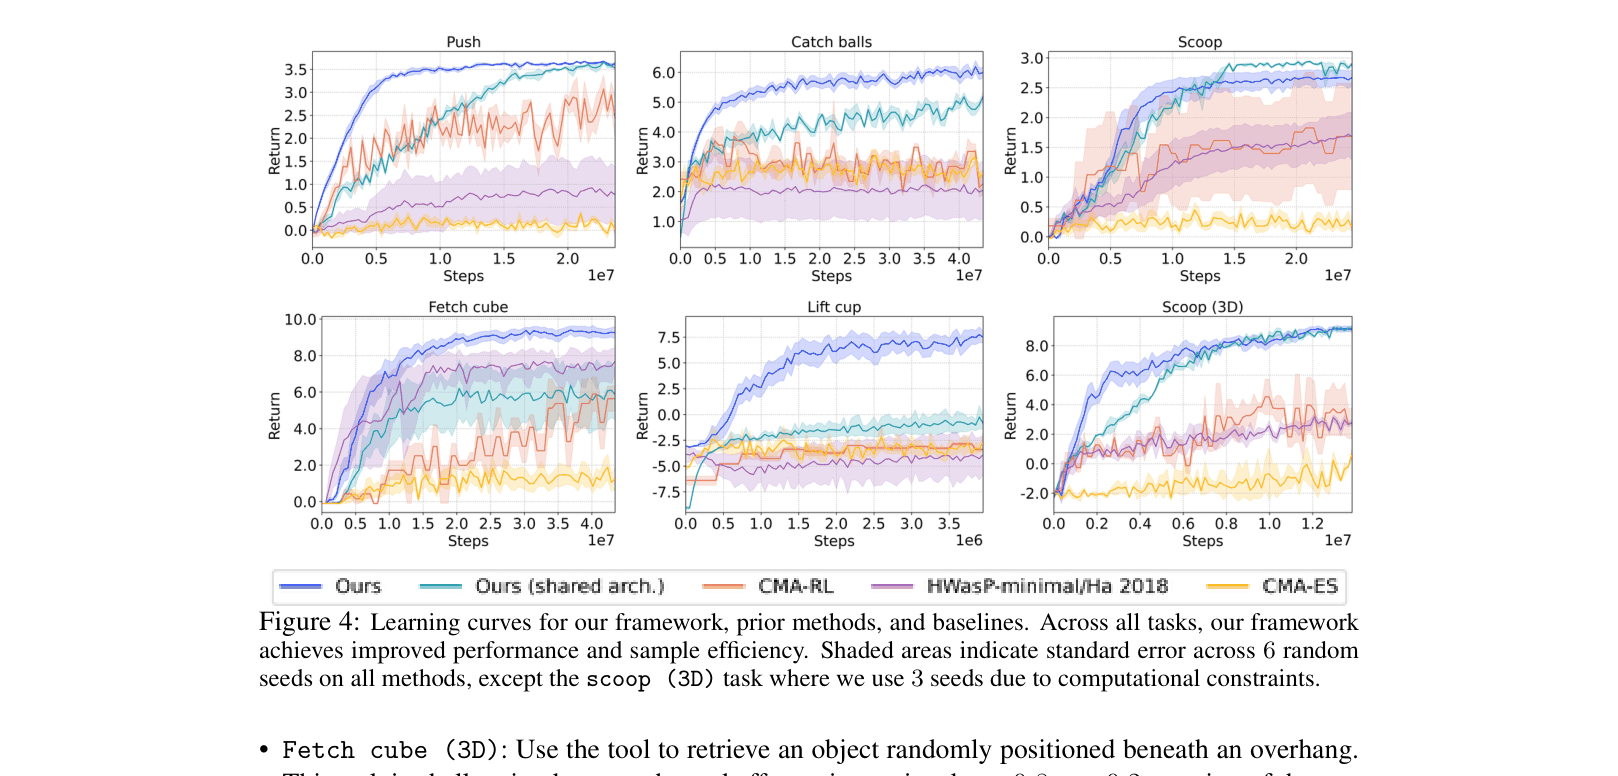
- Achieves higher success rates with fewer samples than CMA-RL and HWasP baselines across 6 simulated manipulation tasks (e.g., reaching ~100% success in 'Push' vs ~60% for baselines)
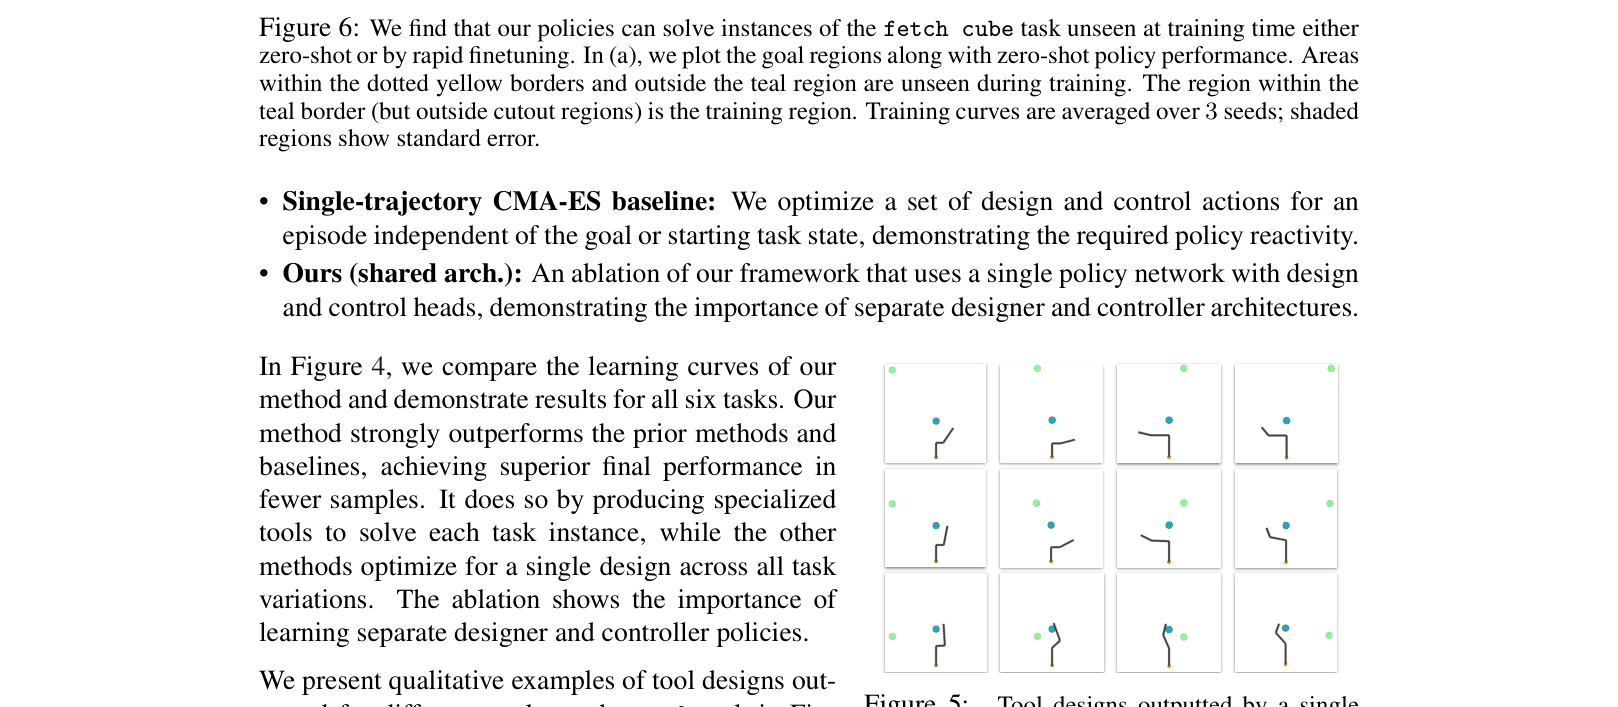
- Zero-shot generalization: Policies trained on a subset of goals can successfully design and use tools for goals in 'cutout' regions never seen during training
- Real-world transfer: 3D-printed tools generated by the policy achieved 100% success (5/5 trials) on specific 'Fetch Cube' and 'Lift Cup' instances on a Franka Panda robot
Breakthrough Assessment
8/10
Significant step in embodied intelligence: moving from static tool use to dynamic tool creation based on immediate needs. Strong sim-to-real results and generalization capabilities.