📊 Experiments & Results
Evaluation Setup
Software engineering issue resolution on SWE-Bench-Verified
Benchmarks:
- SWE-Bench-Verified (Agentic Coding (Issue Resolution))
Metrics:
- Single-run resolution rate (r)
- pass@1 (Mean resolution rate)
- pass@k (Optimistic bound)
- pass^k (Pessimistic bound / Consistency)
- First token divergence position
- Statistical methodology: Computed mean and standard deviation across 10 independent runs per configuration. Explicitly discusses statistical power analysis.
Key Results
| Benchmark | Metric | Baseline | This Paper | Δ |
|---|---|---|---|---|
| Standard deviation analysis reveals that single-run scores are highly unreliable, with variance often exceeding the 'improvements' reported in many papers. | ||||
| SWE-Bench-Verified | pass@1 Range | 28.8 | 32.4 | 3.6 |
| SWE-Bench-Verified | pass@1 Range | 21.4 | 26.4 | 5.0 |
| Temperature 0 analysis shows that 'deterministic' settings are a myth in practice due to system-level noise, and variance remains high. | ||||
| SWE-Bench-Verified | Standard Deviation | 0.0 | 1.0 | +1.0 |
| SWE-Bench-Verified | Standard Deviation | 0.0 | 1.8 | +1.8 |
| Pass@k vs Pass^k analysis reveals the massive gap between potential performance (luck) and consistent performance (skill). | ||||
| SWE-Bench-Verified | Score Gap (pass@5 - pass^5) | 15.5 | 52.9 | +37.4 |
Experiment Figures
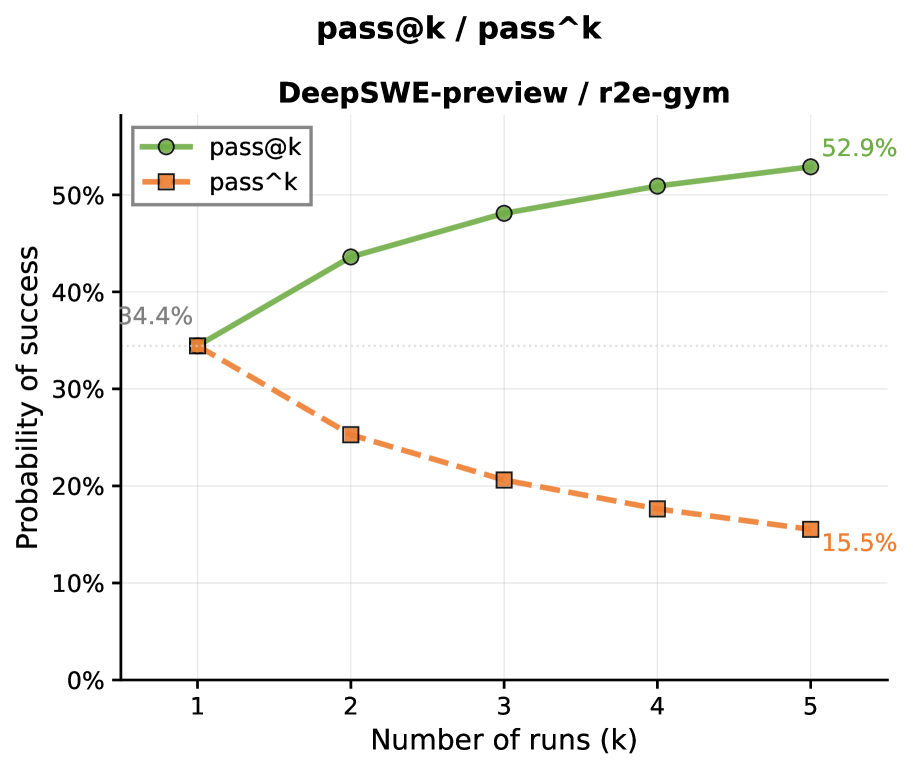
Comparison of pass@k (optimistic) and pass^k (pessimistic) curves as k increases from 1 to 5.

Distribution of the first token divergence position (where two runs first differ) in absolute tokens and percentage of trajectory.
Main Takeaways
- Evaluation noise is non-negligible: A reported 2-3% improvement is statistically indistinguishable from noise when using single-run protocols.
- Temperature 0 is not a fix: System-level non-determinism (floating point, parallelization) preserves variance even with greedy decoding.
- Butterfly Effect: Trajectories diverge within the first 1% of tokens (often first 10-50 tokens), causing agents to adopt fundamentally different strategies early on.
- Recommendation: Researchers must report mean/std over multiple runs (N=10 suggested) and use power analysis to justify sample sizes.