📝 Paper Summary
Offline Inverse Reinforcement Learning (Offline IRL)
Model-Based Reinforcement Learning
CLARE mitigates reward extrapolation error in offline IRL by learning a conservative reward function that penalizes uncertain model rollouts while exploiting expert and diverse data.
Core Problem
Offline IRL suffers from 'reward extrapolation error,' where learned rewards incorrectly value unseen states due to covariate shift, misguiding agents when they stray from the expert's narrow distribution.
Why it matters:
- Standard IRL requires costly online interactions, while offline methods struggle to generalize beyond static datasets.
- Without reinforcement signals, learned rewards often assign high values to out-of-distribution states (OOD), leading to catastrophic policy failure in safety-critical domains like robotics.
Concrete Example:
In a MuJoCo task, an agent trained with standard MaxEnt IRL might learn a reward function that assigns high value to a physically impossible pose never seen in expert data. When the agent attempts this pose during deployment, it fails, because the reward function didn't know to penalize it.
Key Novelty
Conservative Model-Based Reward Learning
- Introduce a pointwise weighting mechanism for reward updates that assigns positive weights to data with low model uncertainty and negative weights (penalties) to uncertain model rollouts.
- Alternates between updating the reward function to explain data conservatively and optimizing a policy within the learned dynamics model (safe policy improvement).
- Theoretical derivation of optimal weights that minimize the return gap between the learned policy and the expert policy.
Architecture
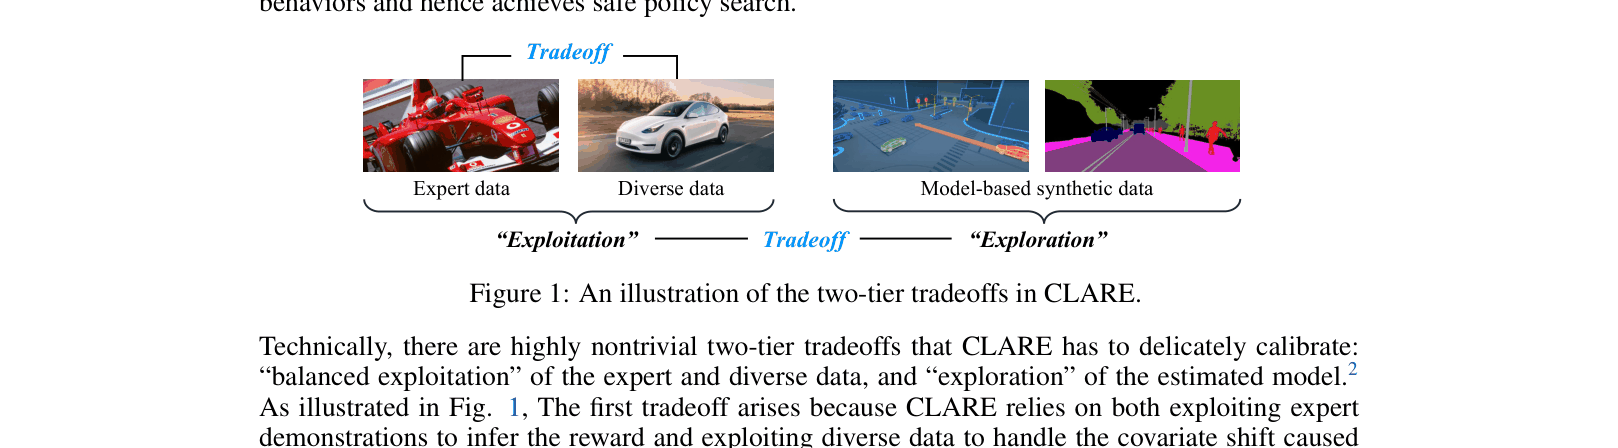
Conceptual illustration of the two-tier tradeoffs in CLARE: Exploitation of Expert/Diverse data vs. Exploration of Model-based synthetic data.
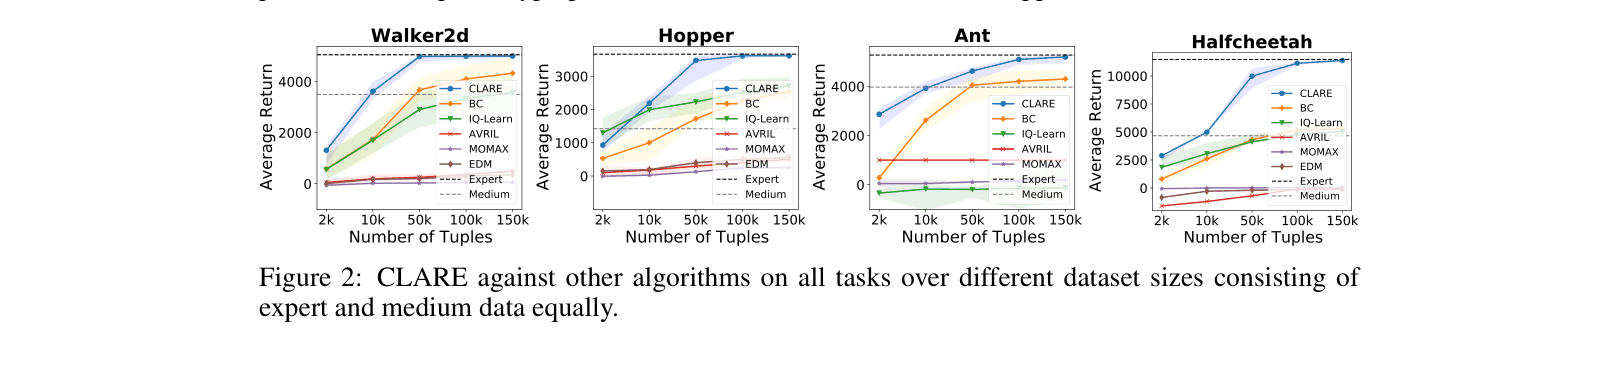
Evaluation Highlights
- Outperforms state-of-the-art IQ-LEARN by over +2000 average return on Half-Cheetah (Expert & Medium dataset mixture).
- Achieves expert-level performance on Walker2d (5010.4 return) using only 10k expert tuples, significantly surpassing Behavior Cloning (4990.5) and IQ-LEARN (1665.7).
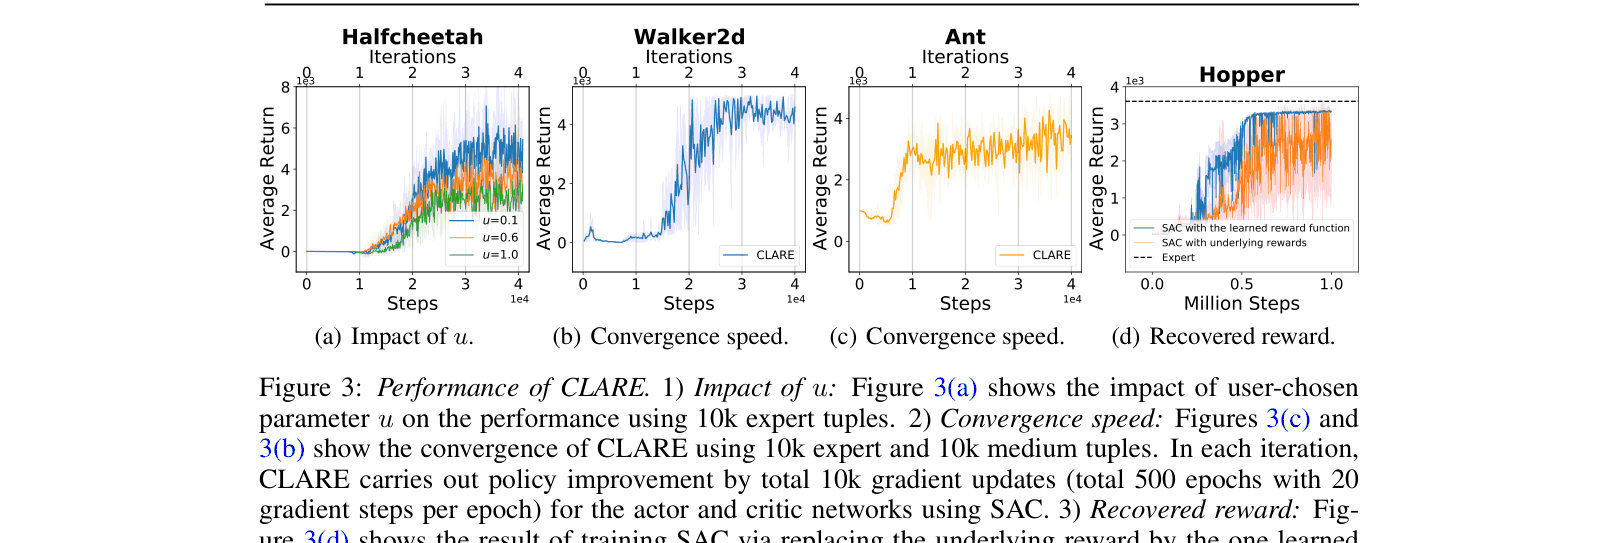
- Demonstrates robust convergence in fewer than 50k gradient steps across multiple MuJoCo tasks.
Breakthrough Assessment
8/10
Provides a principled theoretical framework and strong empirical results for a critical problem (reward extrapolation) in offline IRL, significantly outperforming recent baselines like IQ-Learn.