📝 Paper Summary
Mathematical Reasoning
RLHF / RLAIF
MMR-GRPO accelerates mathematical reasoning training by penalizing semantically redundant completions during reward calculation, reducing wall-clock training time by 70% while maintaining performance.
Core Problem
GRPO-style training is computationally expensive due to generating multiple completions per prompt, and recent efficiency methods like Dynamic Sampling reduce training steps but increase wall-clock time due to high per-step overhead.
Why it matters:
- Lengthy training times create barriers for academic researchers with limited GPU budgets
- Existing efficiency methods (DAPO) create a paradox where fewer training steps result in longer actual training time (up to 3x longer per step)
- High computational costs lead to excessive energy consumption and carbon footprints
Concrete Example:
In a prompt generating 6 completions, if completions C1, C2, and C3 are semantically identical reasoning paths, vanilla GRPO treats them equally. MMR-GRPO identifies this redundancy and downweights C2 and C3, forcing the model to learn from the unique solution C1 and explore other diverse paths like C4 or C6.
Key Novelty
Diversity-Aware Reward Reweighting via Maximal Marginal Relevance (MMR)
- Applies Information Retrieval principles to RL: treats generated completions like search results, where redundancy reduces marginal value
- Reweights rewards within a group by subtracting a diversity penalty based on semantic similarity to already selected high-reward completions
- Uses a parameter-free adaptive mechanism to automatically tune the diversity-relevance trade-off based on the reward variance of the group
Architecture
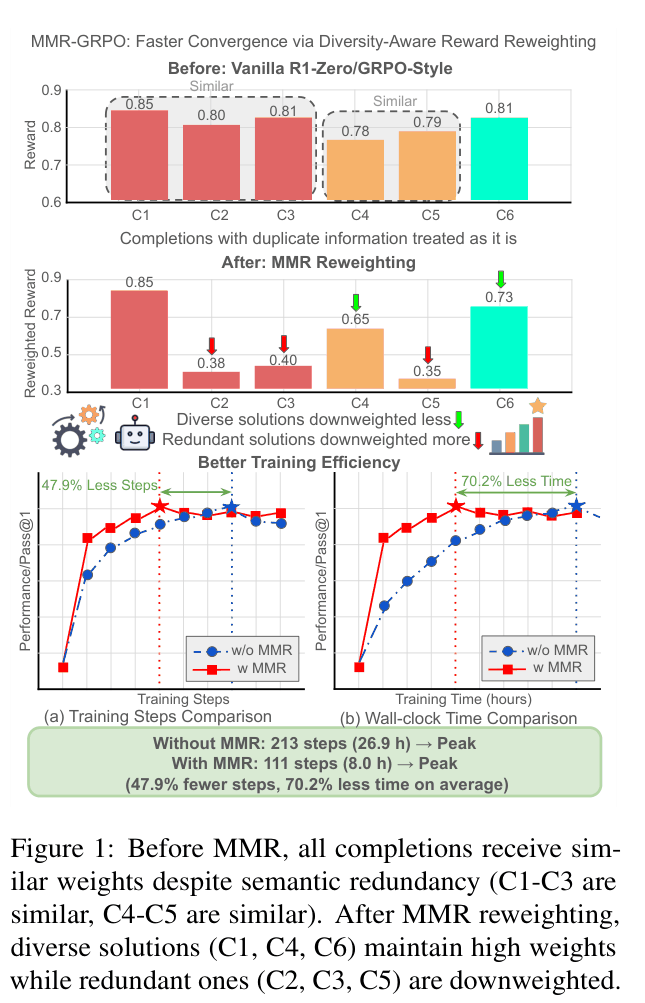
Conceptual comparison of vanilla GRPO vs. MMR-GRPO reward weighting
Evaluation Highlights
- Reduces wall-clock training time by 70.2% on average across 1.5B, 7B, and 8B models compared to GRPO and DAPO baselines
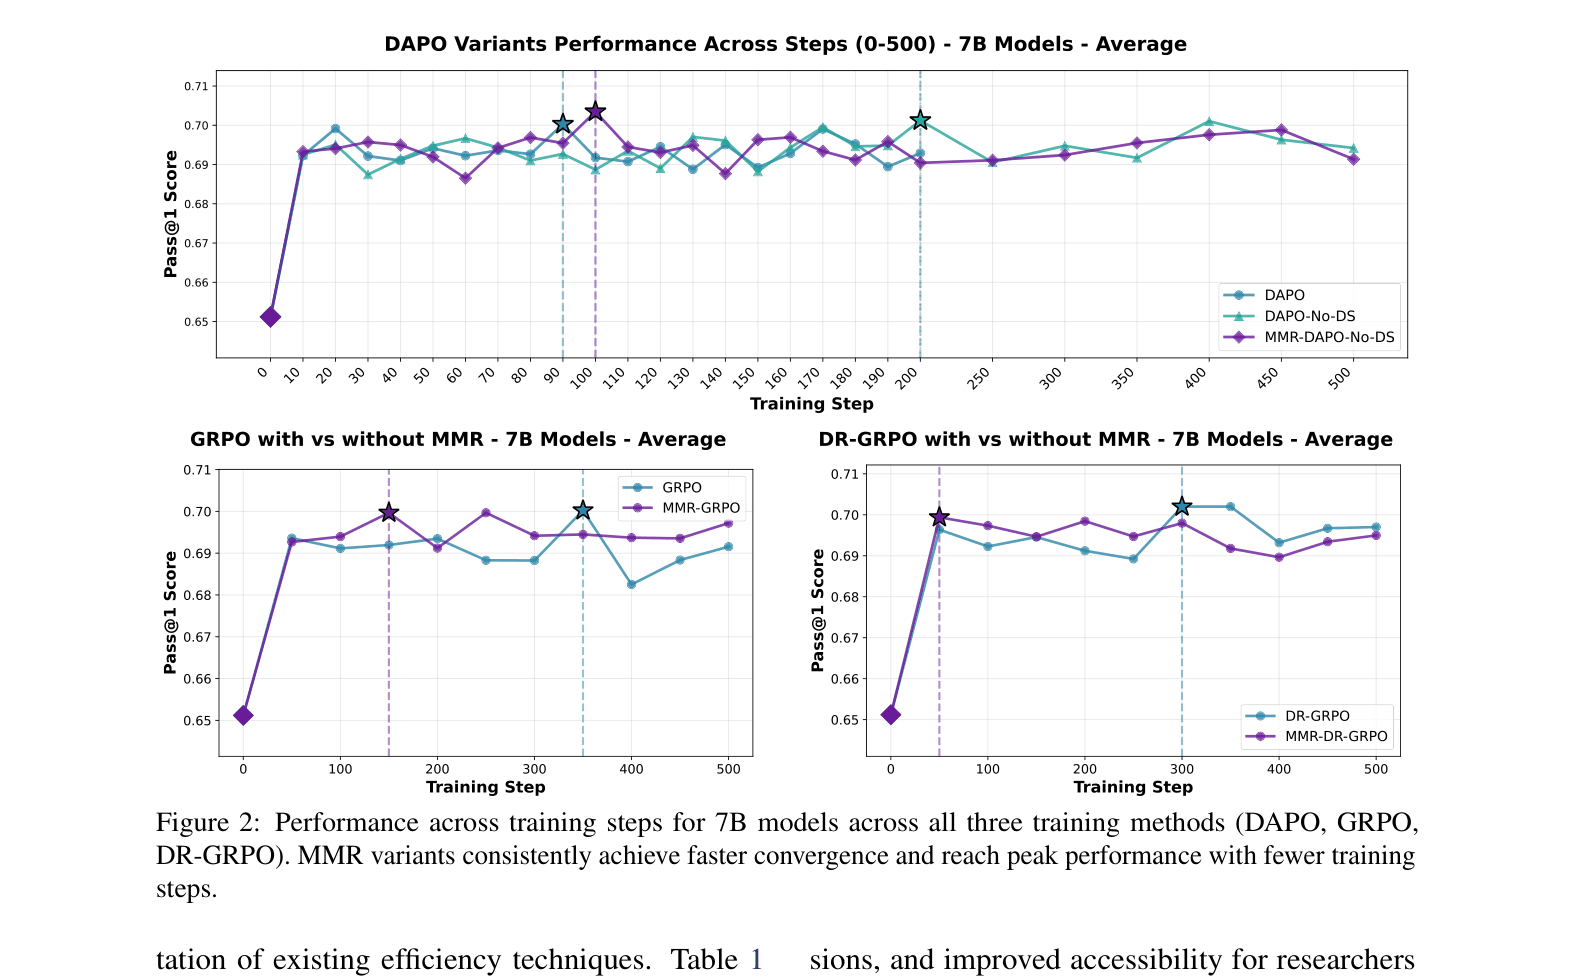
- Achieves peak performance in 47.9% fewer training steps on average across five mathematical benchmarks (including AIME 2024 and MATH-500)
- Reduces training time for DeepSeek-R1-Distill-Llama-8B from 93.75 hours (DAPO) to 17.40 hours (MMR-DAPO-No-DS) while maintaining comparable accuracy
Breakthrough Assessment
8/10
Addresses a critical, practical inefficiency in current reasoning RL methods (wall-clock time vs. steps). The parameter-free adaptive mechanism makes it highly usable. Significant time savings (70%) with no performance loss.