📝 Paper Summary
LLM Post-training
Supervised Fine-Tuning (SFT)
Reinforcement Learning (RL)
SED-SFT prevents mode collapse by applying an entropy regularization penalty only to tokens with high exploration potential, thereby improving diversity for subsequent reinforcement learning without degrading accuracy on rigid tokens.
Core Problem
Standard Cross-Entropy (CE) loss in SFT drives models to converge on single ground-truth paths (mode collapse), severely restricting the exploration space required for effective downstream Reinforcement Learning.
Why it matters:
- Lack of diversity during SFT limits the model's ability to explore alternative reasoning paths during RL, leading to suboptimal final performance
- Existing solutions like GEM blindly encourage diversity on all tokens, damaging accuracy on rigid structural tokens (e.g., 'The answer is') where no diversity is needed
Concrete Example:
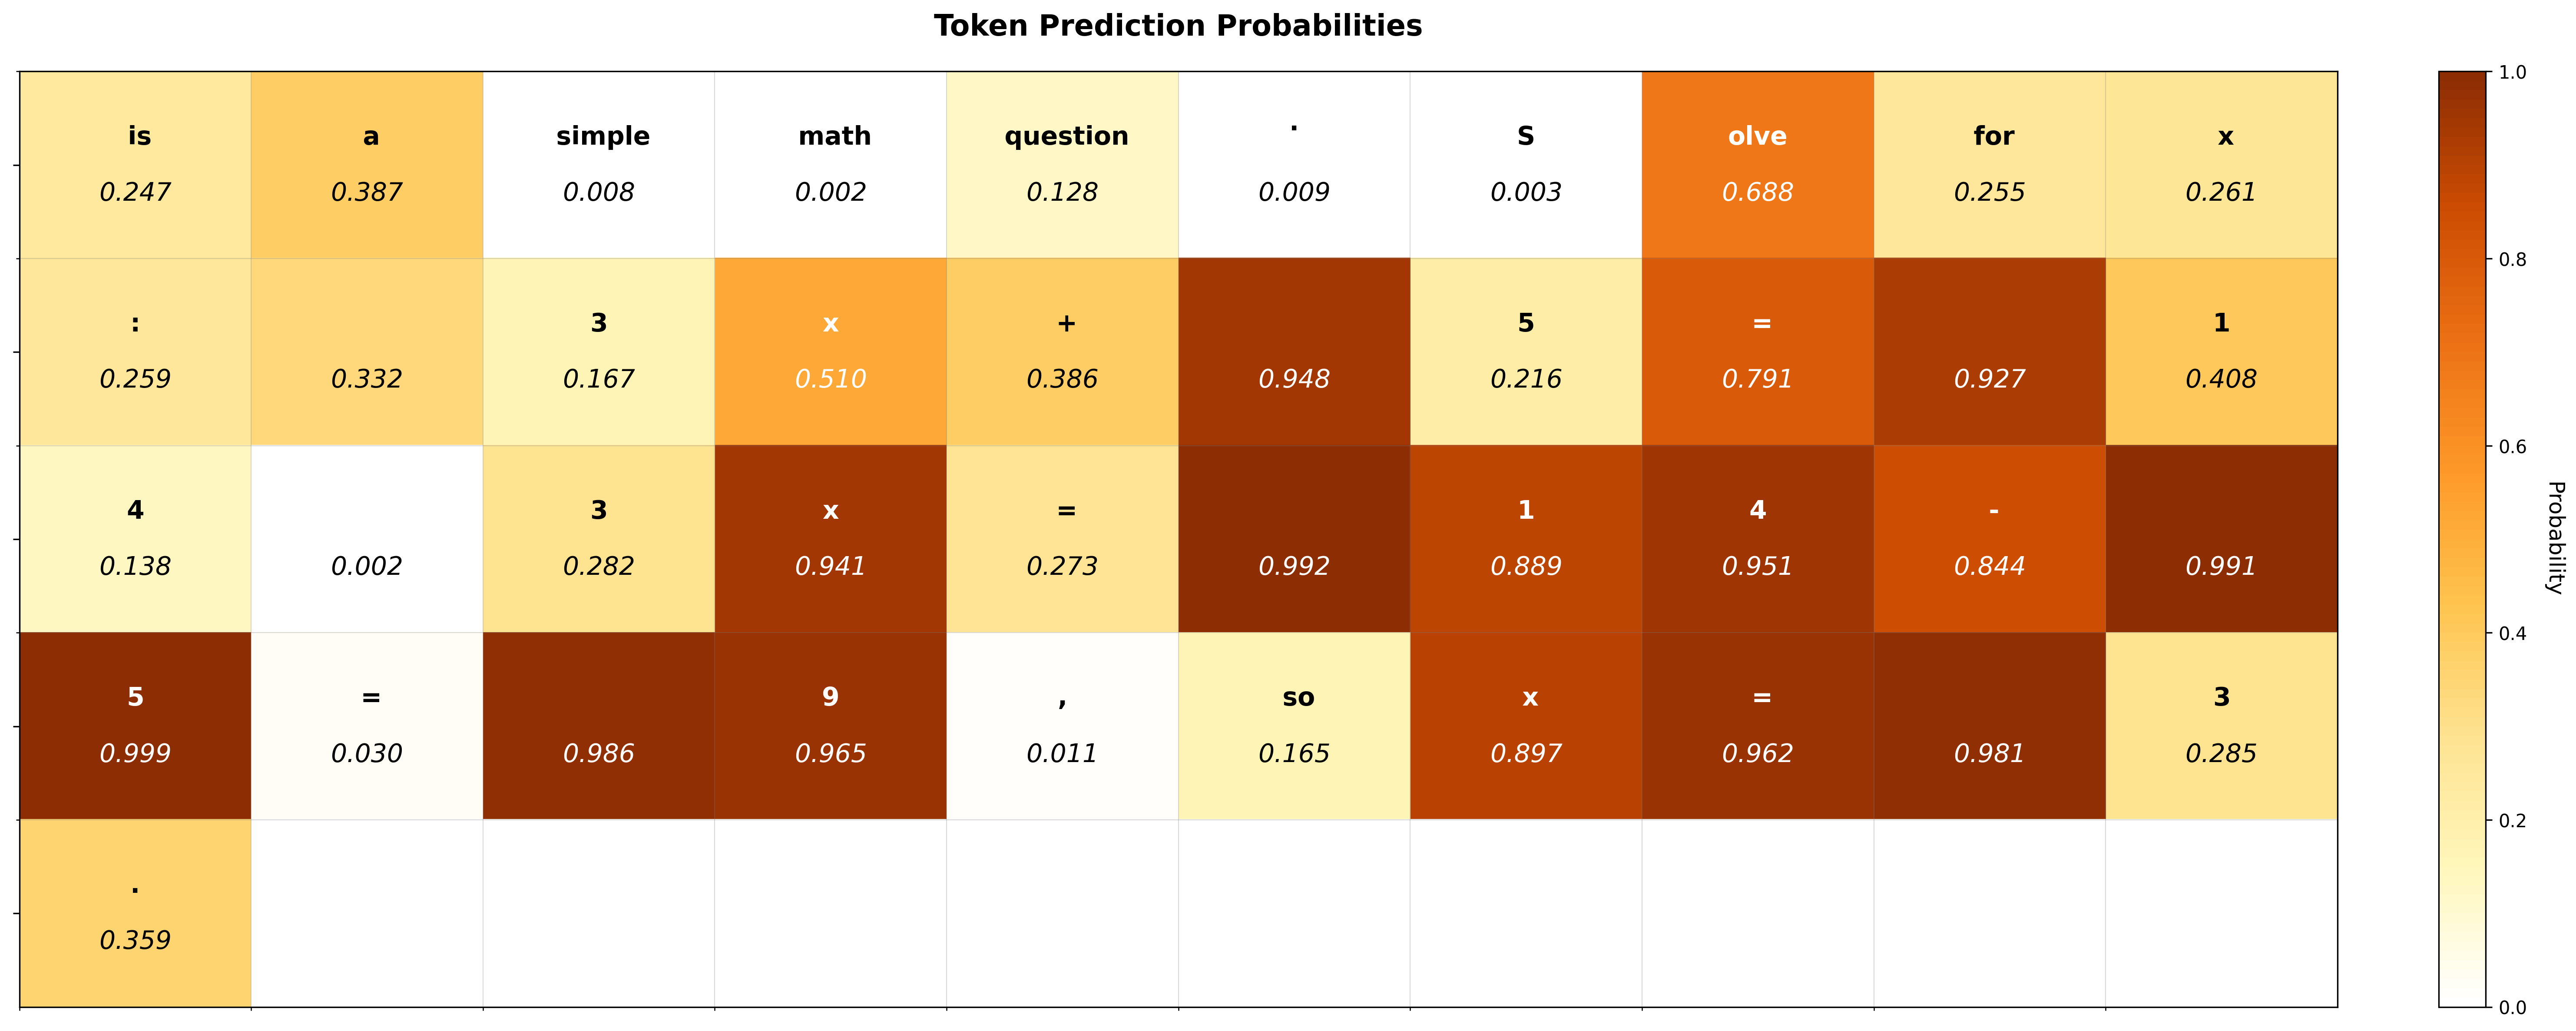
In a math proof, the phrase 'The answer is' requires rigid adherence to syntax (low exploration need), while the subsequent reasoning steps allow for varied approaches. Naive diversity methods force the model to lower its confidence on 'is', hurting coherence. SED-SFT detects the low exploration space of 'is' and masks the penalty, applying it only to the reasoning tokens.
Key Novelty
Selectively Encouraging Diversity (SED)
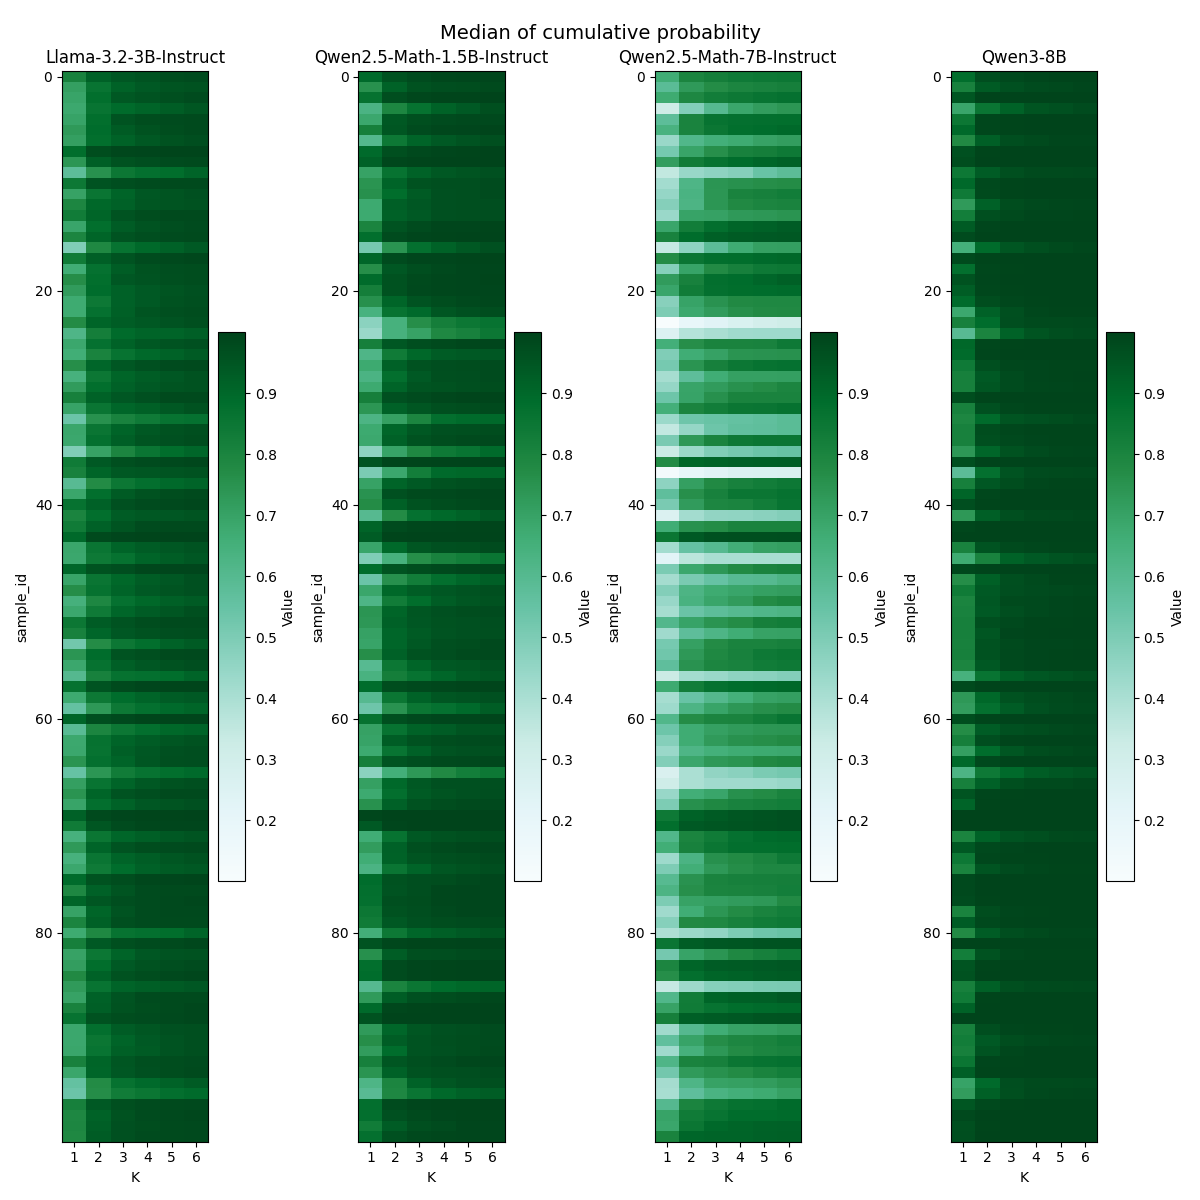
- Identifies 'flexible' vs. 'rigid' tokens using the cumulative probability of the top-k predicted tokens as a proxy for exploration space
- Applies a masking mechanism to the entropy regularization term, ensuring the model is only pushed towards diversity (probability 0.5) on tokens where alternative valid paths likely exist
Architecture
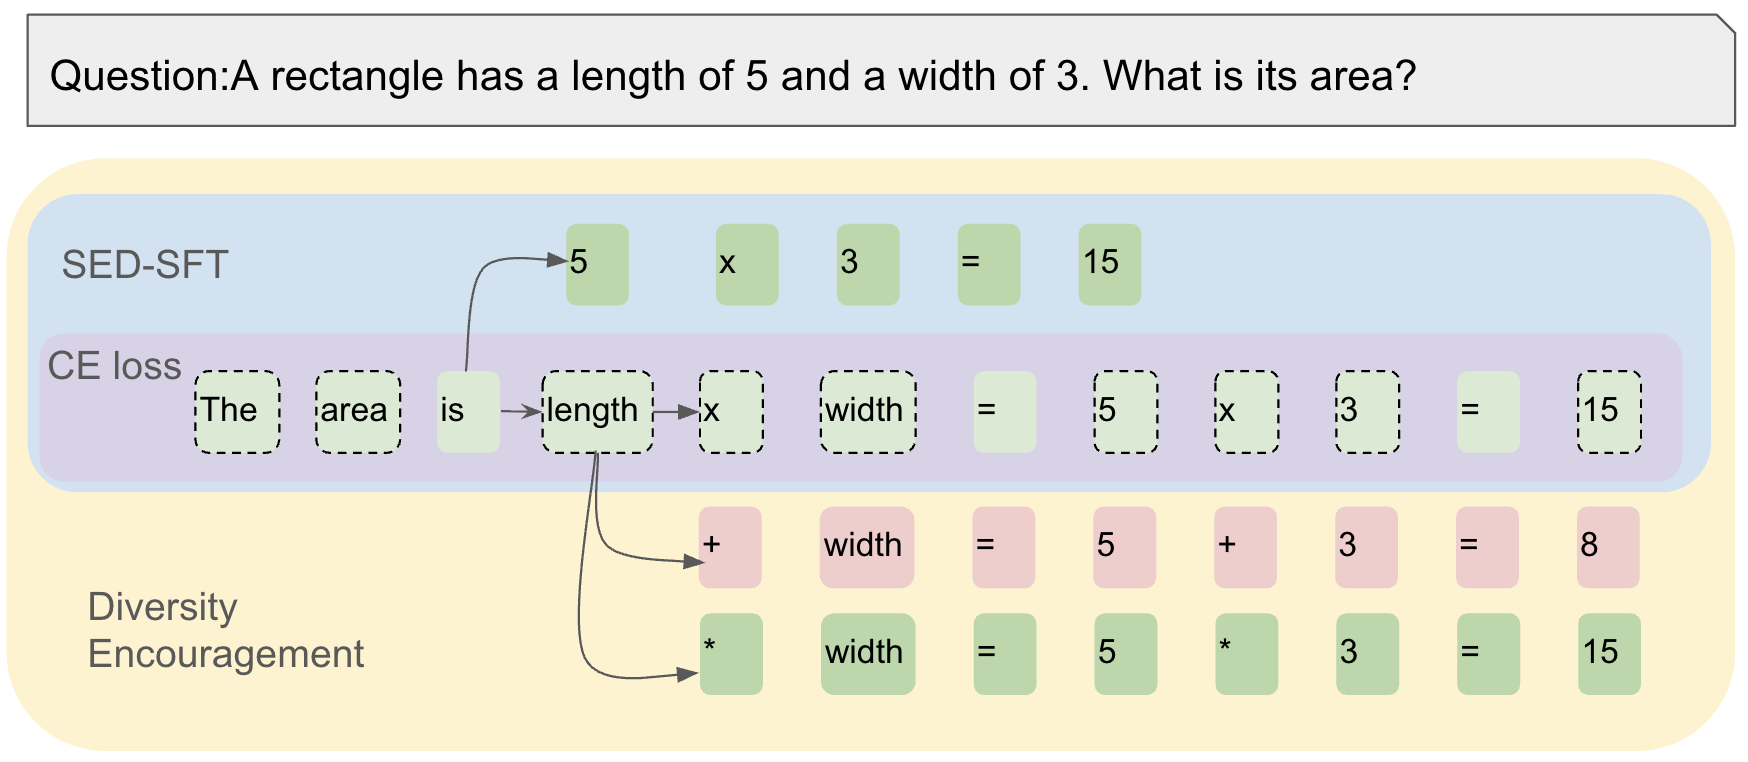
Concept diagram of SED-SFT showing how the loss function treats different tokens differently
Evaluation Highlights
- +2.06 points average improvement on Llama-3.2-3B-Instruct across 8 math benchmarks after RL compared to standard Cross-Entropy SFT
- +1.20 points average improvement on Qwen2.5-Math-7B-Instruct across 8 math benchmarks after RL compared to standard Cross-Entropy SFT
- Outperforms specialized SFT baselines (GEM and DFT) which failed to consistently improve over simple Cross-Entropy in the SFT-then-RL setting
Breakthrough Assessment
7/10
Offers a logically sound and effective fix for SFT mode collapse with consistent gains. While the scope is limited to math/reasoning SFT strategies, the selective masking idea is a valuable refinement over indiscriminate entropy regularization.