📝 Paper Summary
Mobile Device Agents
GUI Navigation
Multimodal Large Language Models (MLLM)
Mobile-Agent leverages visual perception tools to ground GPT-4V's planning in precise screen coordinates, enabling autonomous mobile app navigation without relying on system-level XML files.
Core Problem
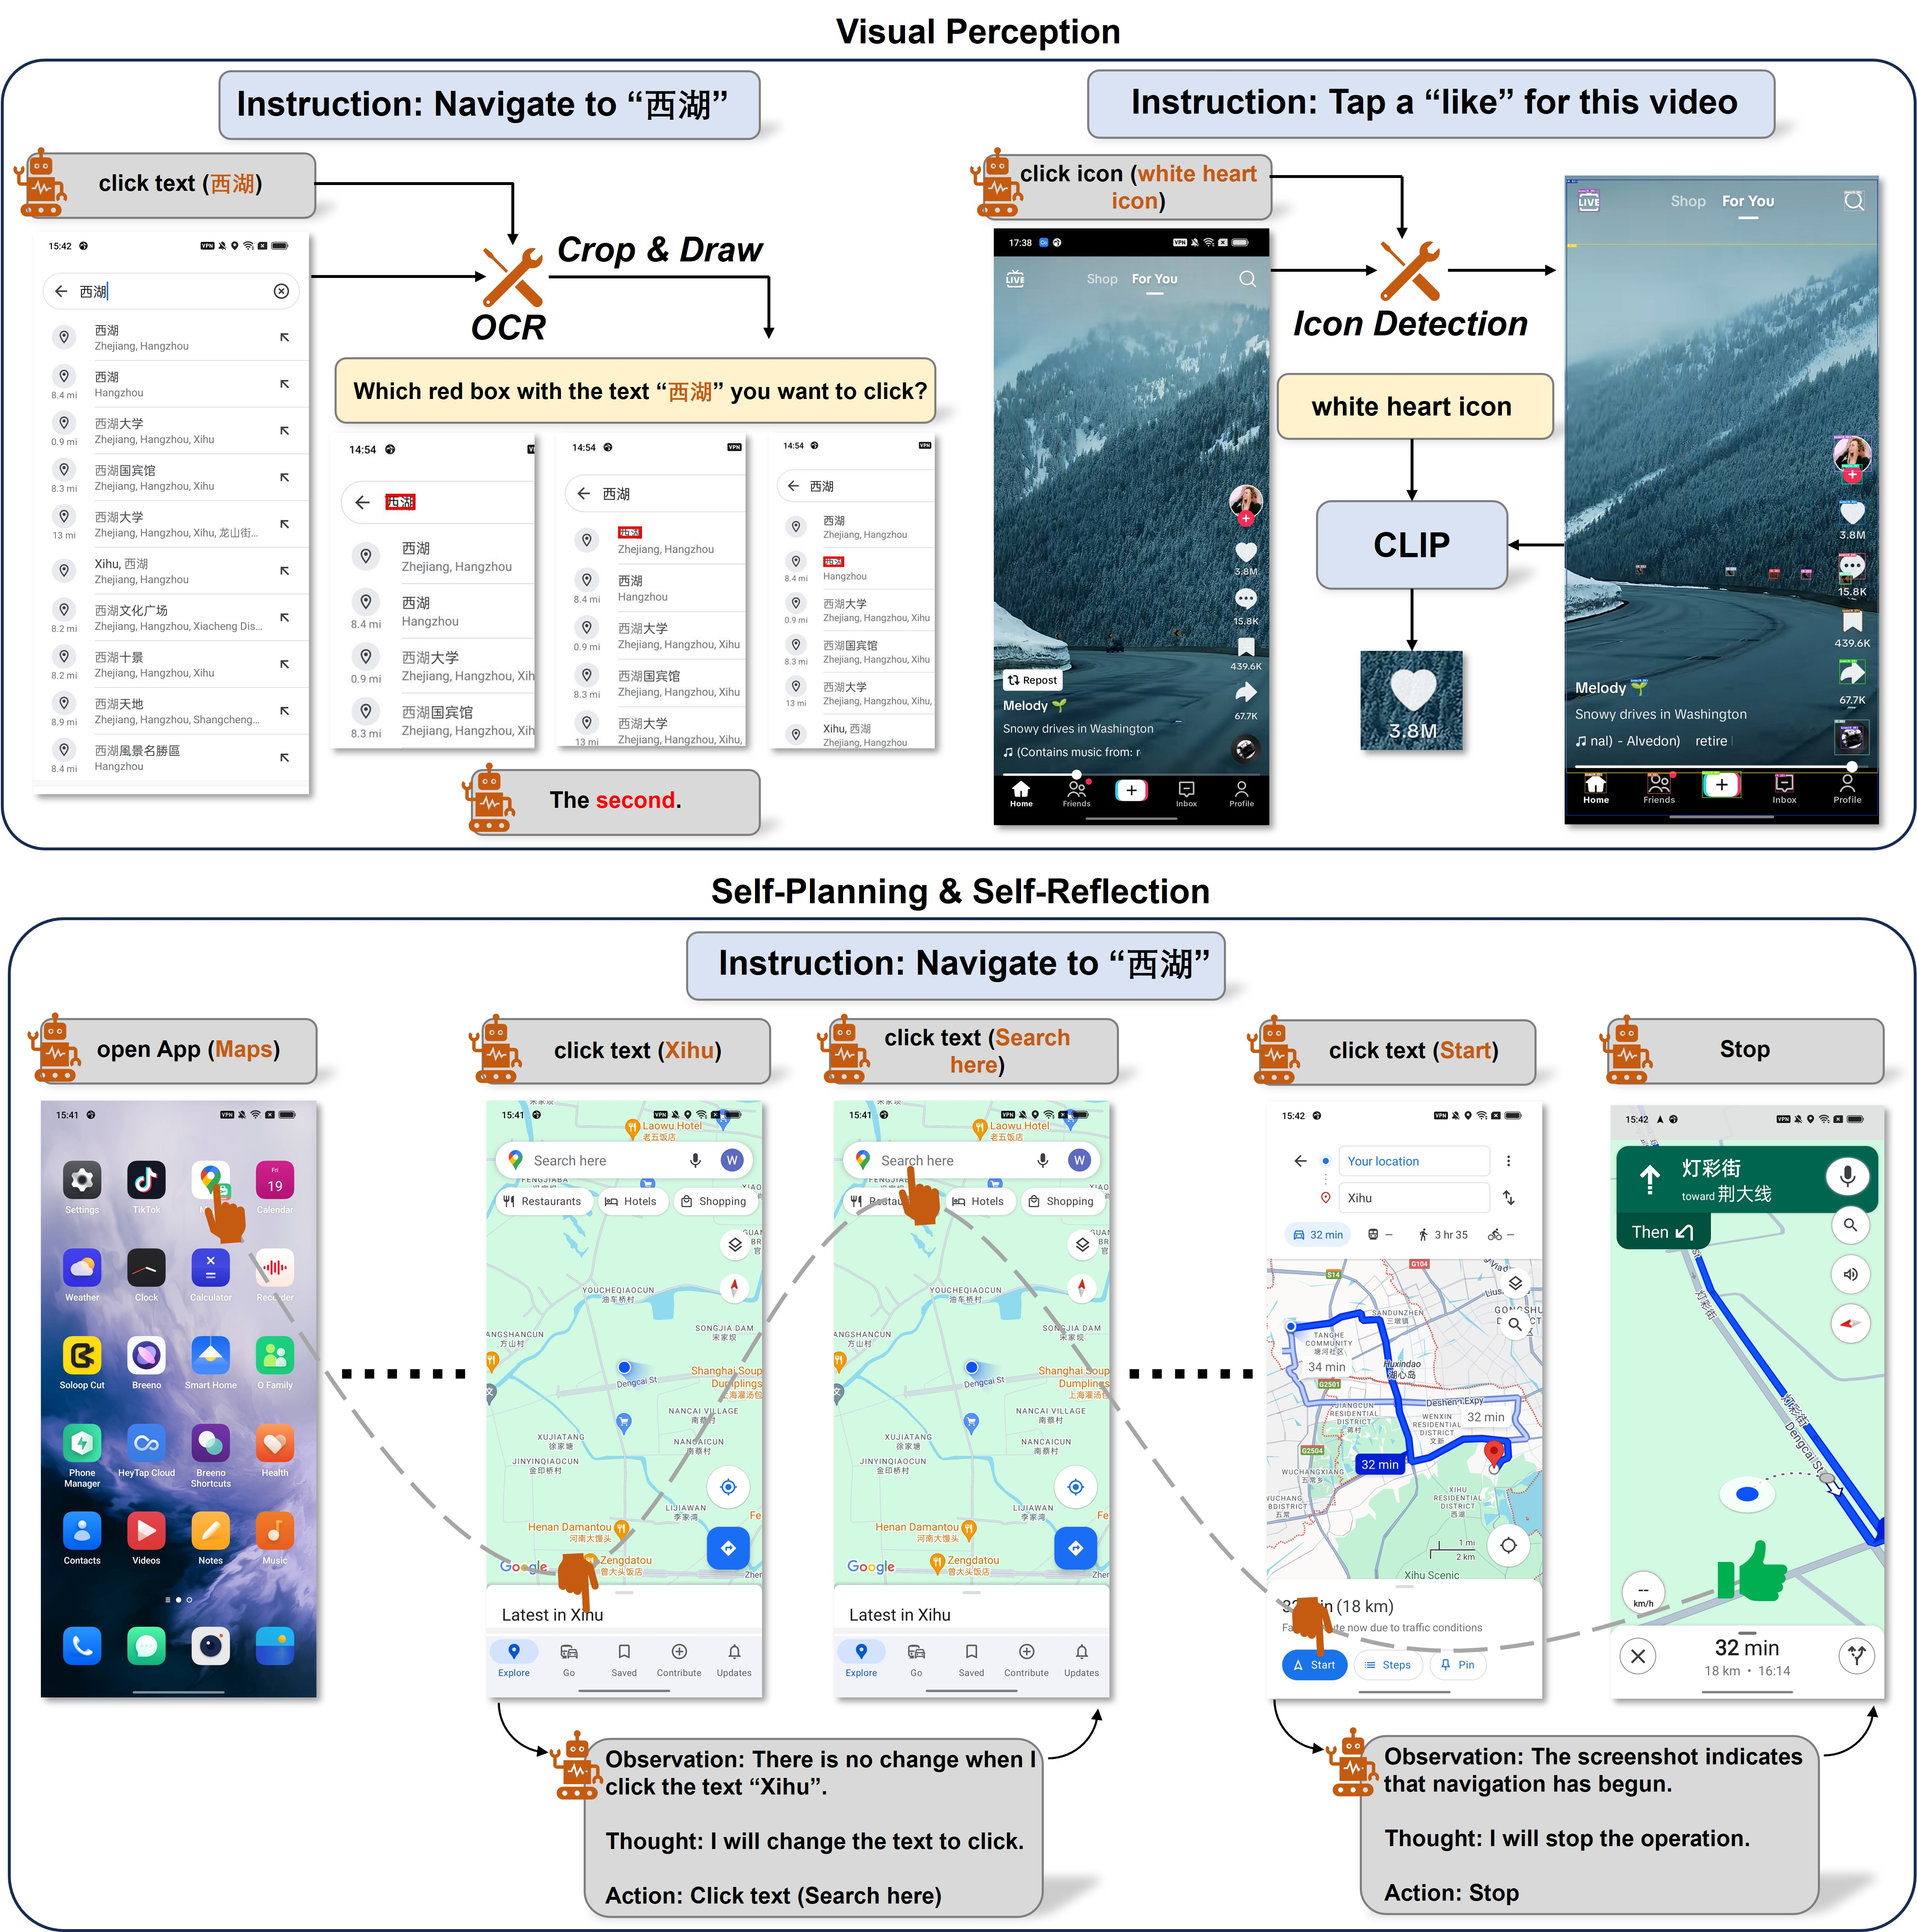
State-of-the-art MLLMs like GPT-4V can plan operations but struggle to accurately locate specific UI elements (coordinates) on a screen, and existing solutions rely on often-inaccessible underlying system files (XML/HTML).
Why it matters:
- Relying on XML/HTML files limits agents to specific operating systems or apps where permissions are available
- Purely visual agents are more universal but have historically lacked the precision to click small icons or text reliably
- Automating mobile tasks requires handling dynamic interfaces where elements shift or appear across multiple apps
Concrete Example:
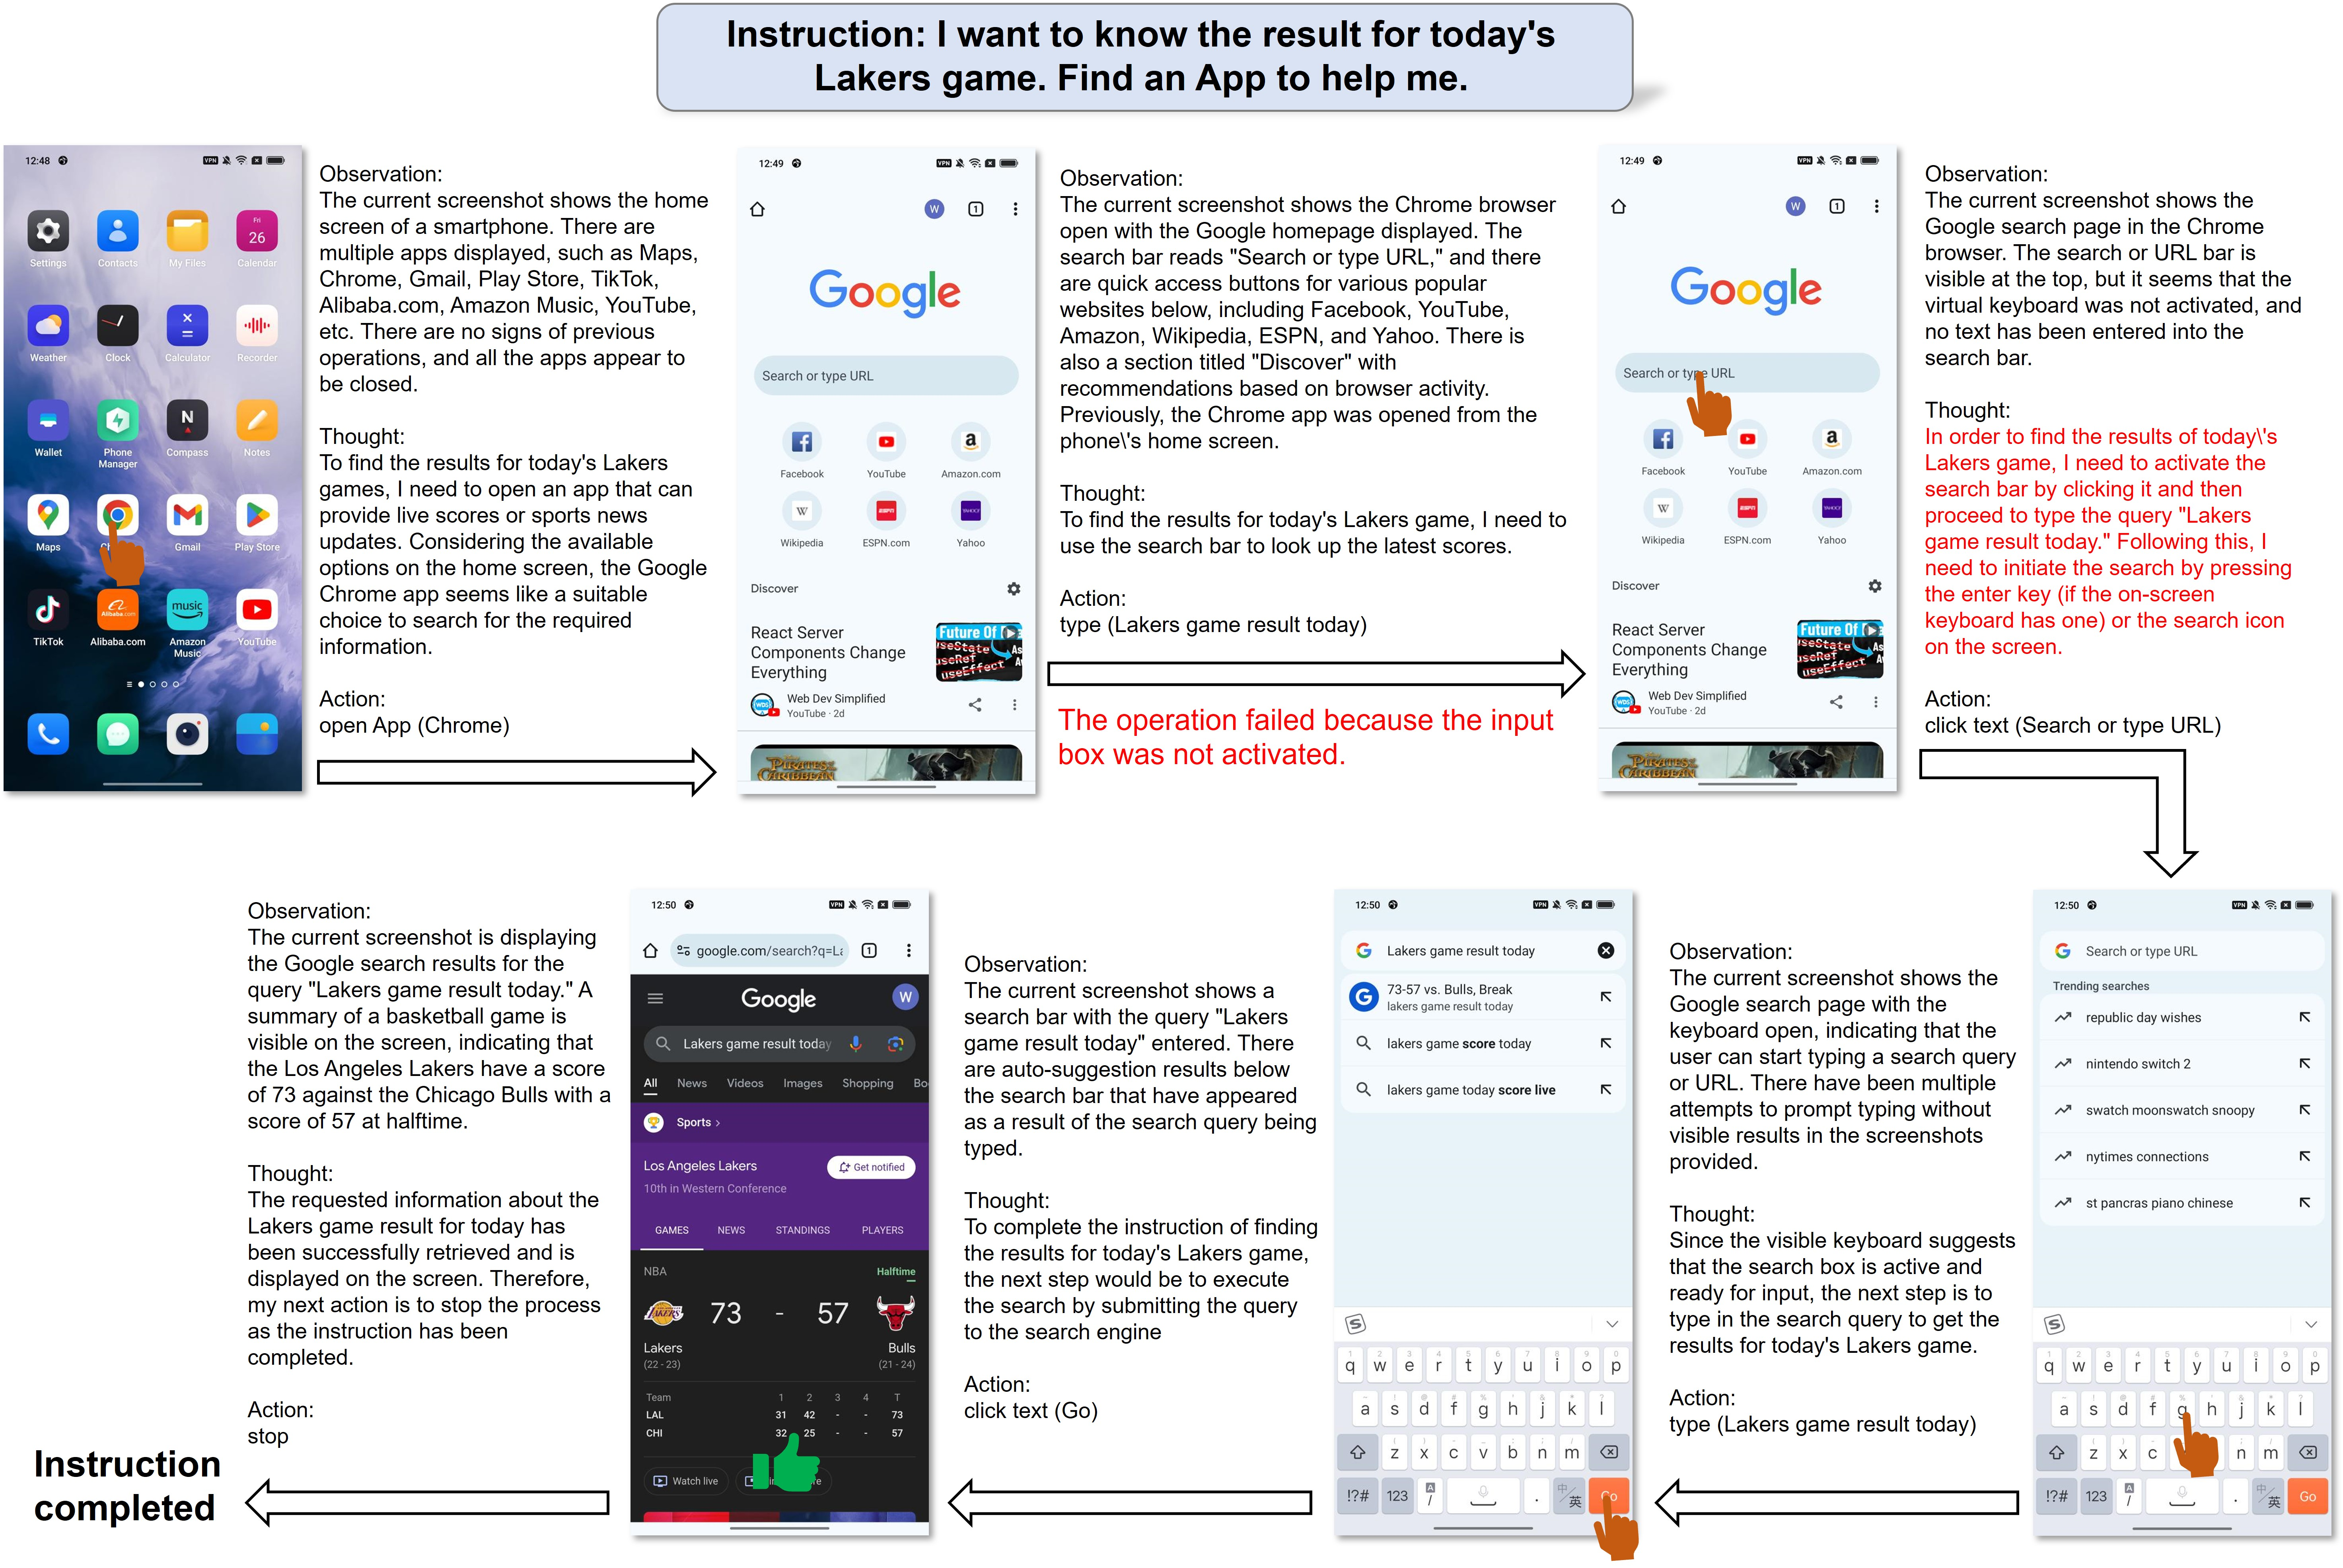
When asking an agent to 'play a video,' GPT-4V might know it needs to click the 'play' button but outputs incorrect coordinates because it cannot verify the exact pixel location. Mobile-Agent solves this by detecting the icon visually and cropping the region for verification.
Key Novelty
Vision-Centric Autonomous Mobile Agent
- Decouples planning from localization: GPT-4V handles high-level reasoning, while specialized visual tools (OCR, detection models) handle precise coordinate extraction
- Purely vision-based solution that operates solely on screenshots, eliminating the need for Android XML hierarchy or system metadata access
- Implements a self-reflection mechanism where the agent analyzes history and screenshot changes to correct invalid operations or stuck states
Architecture
The Mobile-Agent framework workflow.
Evaluation Highlights
- Achieved 91% completion rate on basic instruction tasks (Instruction 1) in the Mobile-Eval benchmark
- Maintained >80% completion rate even on challenging multi-app and abstract instructions
- Demonstrated ~80% relative efficiency compared to optimal human operations across tested tasks
Breakthrough Assessment
8/10
Significant step towards universal GUI agents by removing dependency on system files (XML). The combination of visual tools with MLLM planning is a practical, effective solution for the 'grounding problem' in UI agents.