📝 Paper Summary
Visual Math Problem Solving
Multi-modal LLM Evaluation
Reasoning Benchmarks
MathVerse exposes that Multi-modal LLMs often rely on textual shortcuts in math problems by testing them on six problem variations with progressively reduced text and increased visual dependency.
Core Problem
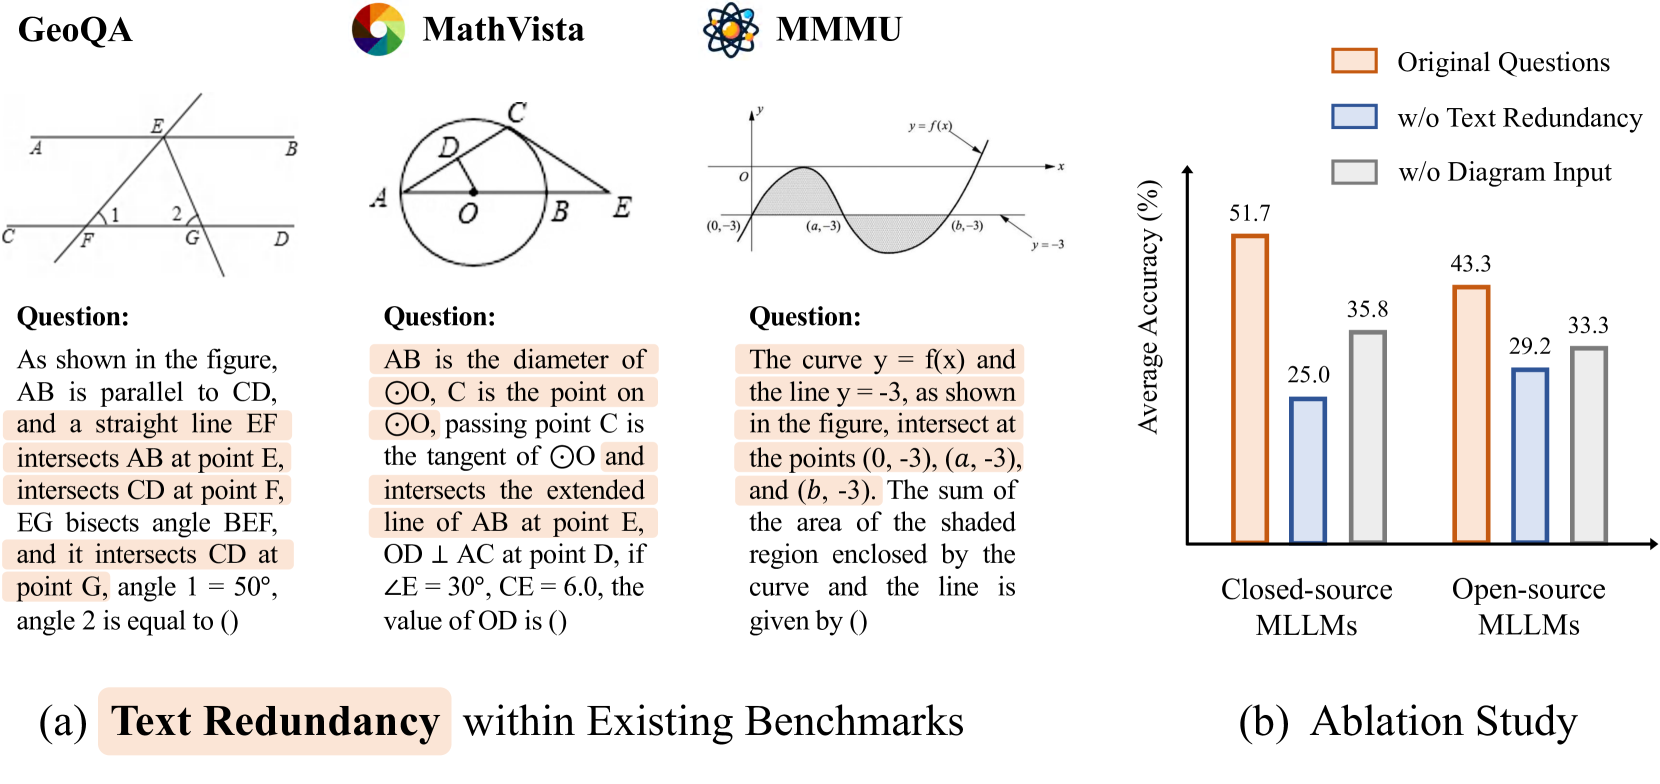
Existing visual math benchmarks contain questions with redundant text that explicitly describes the diagram (e.g., 'Triangle ABC'), allowing models to solve problems without actually interpreting the visual input.
Why it matters:
- Current high scores on math benchmarks may be illusory, reflecting text-processing skills rather than genuine multi-modal reasoning
- Binary evaluation (Correct/Incorrect) fails to capture whether a model used the correct visual reasoning process or just guessed based on text patterns
Concrete Example:
In a geometry problem where the text states 'Angle A is 45 degrees' and the diagram also shows '45°', an MLLM can solve it purely from text. MathVerse creates a version where the text only asks 'Find the angle' (forcing the model to read '45°' from the diagram), causing many models to fail.
Key Novelty
MathVerse Benchmark & CoT Evaluation Strategy
- Transforms each math problem into six versions (e.g., Text-dominant vs. Vision-only) by systematically removing textual cues (Descriptive Information, Implicit Properties) to isolate visual understanding
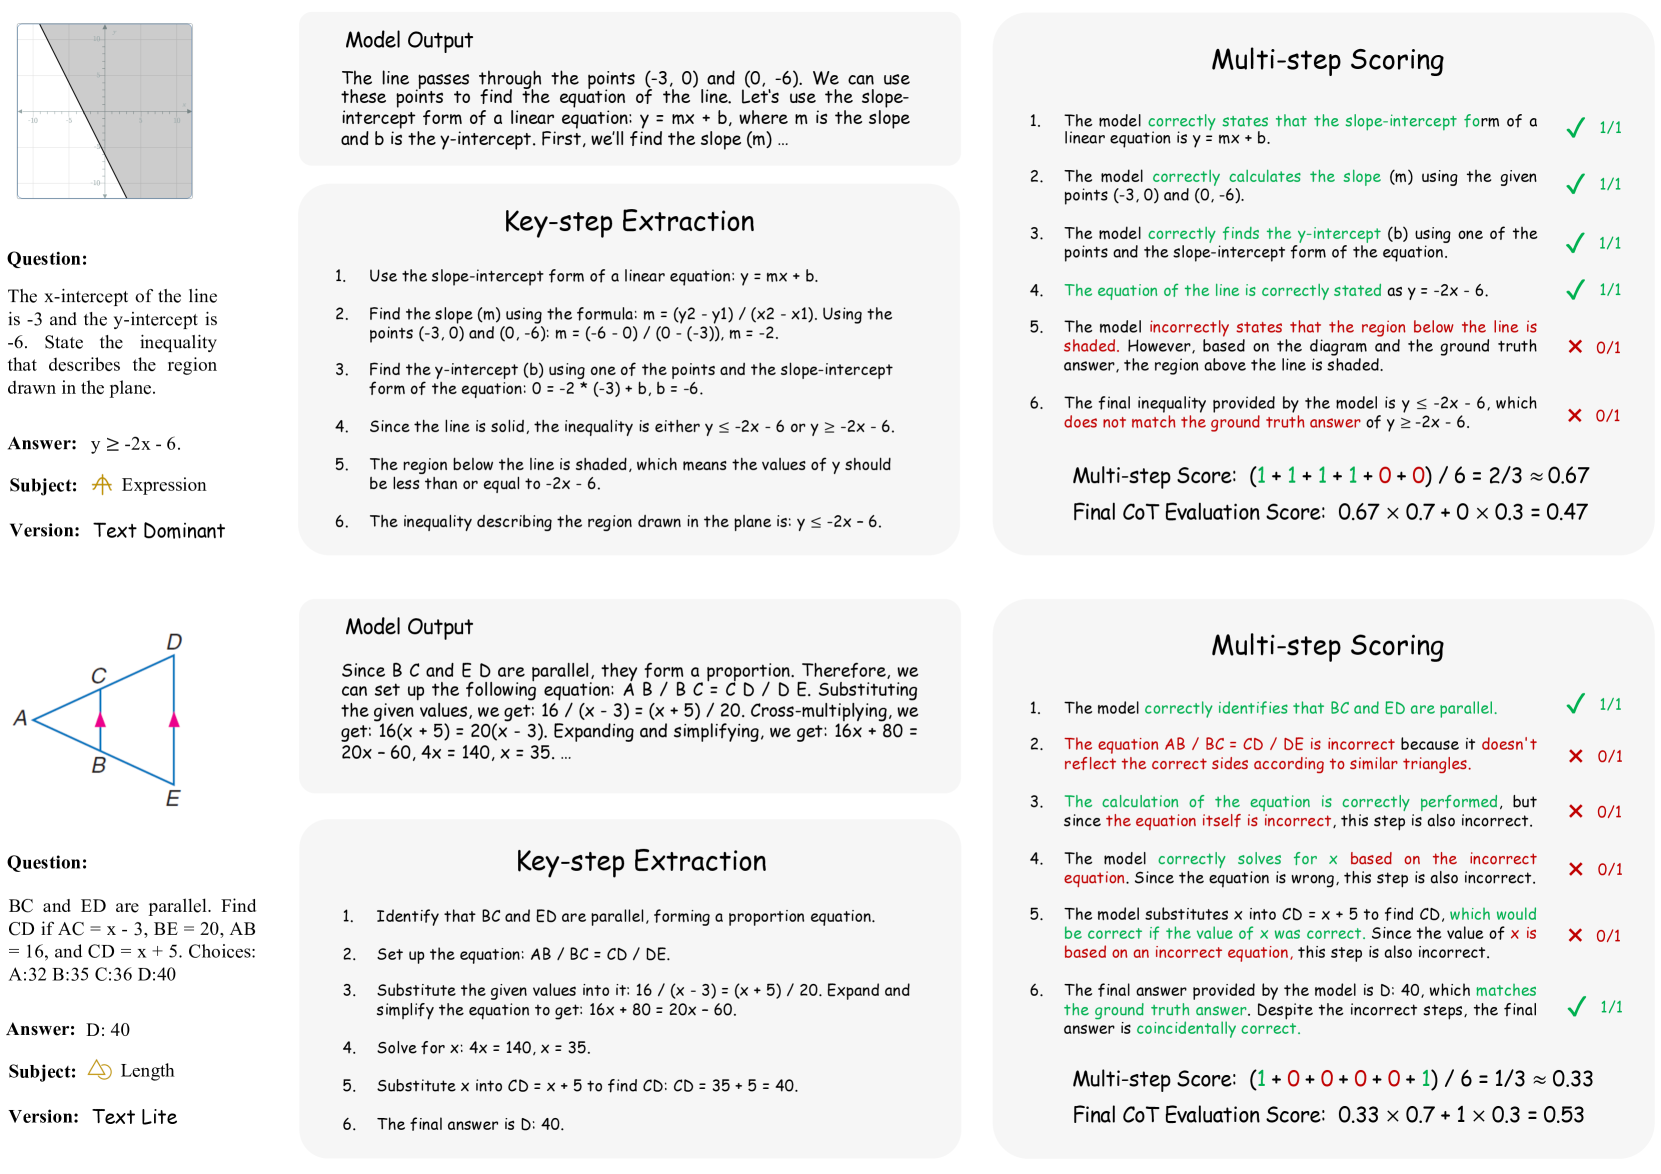
- Proposes a Chain-of-Thought (CoT) evaluation where GPT-4 extracts reasoning steps and GPT-4V scores them, assessing the logic process rather than just the final answer
Architecture
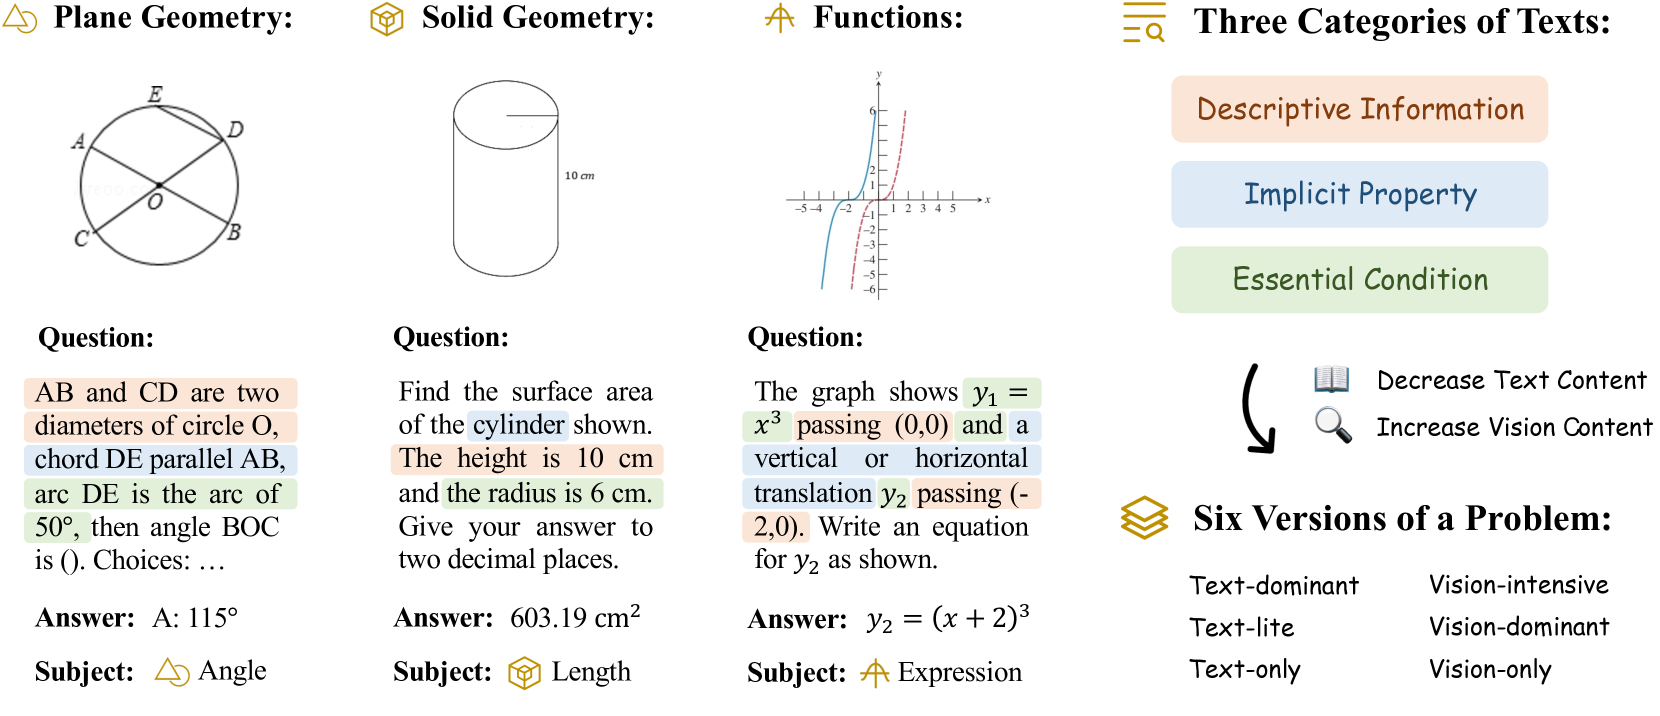
The data transformation process creating six versions of a single math problem to test different levels of visual dependency.
Evaluation Highlights
- Qwen-VL-Max achieves +5.1% higher accuracy on Text-only versions compared to diagrams, proving it treats diagrams as distractions rather than information sources
- InternLM-XComposer2 scores +5.6% higher without visual input, further confirming reliance on textual shortcuts over visual reasoning
- GPT-4V demonstrates the best visual comprehension but still suffers performance drops when redundant textual descriptions are removed
Breakthrough Assessment
9/10
Critically exposes a fundamental flaw in how MLLMs are evaluated (blindness to diagrams due to redundant text) and provides a rigorous methodology (six-version transformation) to address it.