📊 Experiments & Results
Evaluation Setup
Analyze 33,000 generations (110 cultures * 300 samples) to classify symbol sources
Benchmarks:
- Culture-Conditioned Generation (Custom) (Open-ended text generation) [New]
Metrics:
- Percentage of symbols classified as Memorized / Diffuse / Cross-Culture / Weak
- Contribution Score (Cs)
- Overshadowing Ratio
- Statistical methodology: Z-score thresholding (>2.6) to identify statistically significant associations in contribution score distributions
Key Results
| Benchmark | Metric | Baseline | This Paper | Δ |
|---|---|---|---|---|
| Breakdown of generation sources shows a significant portion relies on memorization, with differences between topics. | ||||
| Food Generation | Percentage Memorized | Not reported in the paper | 46 | N/A |
| Clothing Generation | Percentage Memorized | Not reported in the paper | 26 | N/A |
| Diffuse Association | Prevalence | Not reported in the paper | 50 | N/A |
Experiment Figures
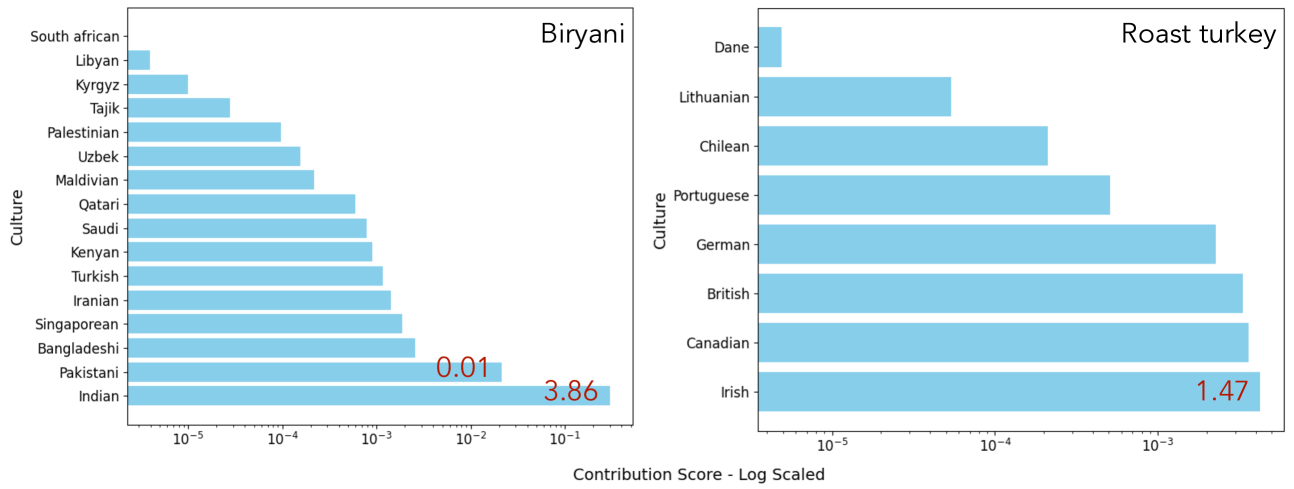
Distribution of Contribution Scores across cultures for specific symbols (e.g., 'sushi')
Main Takeaways
- Memorized associations correlate strongly with a culture's frequency in pretraining data; low-frequency cultures produce zero memorized symbols.
- Models resort to 'Diffuse Associations' (generic terms like 'meat' or 'shirt') when they lack specific memorized knowledge, often overshadowing specific cultural symbols.
- Cross-culture generalization occurs where a symbol memorized for a high-frequency culture (e.g., Japan) is generated for a correlated culture (e.g., Korea).
- Weak association generalization involves the model synthesizing broad concepts (e.g., 'robe') from memorized specific symbols (e.g., 'kimono'), showing some capability to generalize beyond rote memorization.