📝 Paper Summary
Vision-Language Models (VLMs)
Chart Understanding and Reasoning
Reasoning with Reinforcement Learning
Chart-R1 improves complex chart reasoning by combining a programmatically synthesized dataset of verifiable reasoning paths with a two-stage training strategy involving CoT supervision and reinforcement fine-tuning.
Core Problem
Existing Vision-Language Models struggle with complex chart reasoning tasks, particularly those requiring precise numerical comprehension, multi-level visual understanding, and logical inference across multi-subchart scenarios.
Why it matters:
- Charts are information-intensive images crucial for data analysis, yet models often fail at deep reasoning beyond simple extraction
- Prior supervised fine-tuning (SFT) approaches cause models to overfit specific patterns, hindering generalization to complex, multi-step problems
- Existing RL-based VLM methods focus primarily on perception or simple tasks, neglecting the deep multi-step reasoning needed for complex chart analysis
Concrete Example:
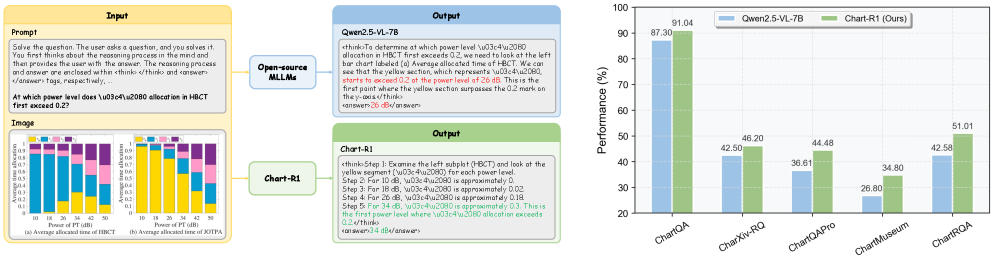
In multi-chart scenarios (e.g., comparing trends across two separate graphs), a standard model might hallucinate values or fail to cross-reference axes. Chart-R1 uses a synthesized reasoning path to explicitly decompose the task: 'First, identify the peak in Chart A... Second, find the corresponding value in Chart B... Finally, calculate the difference.'
Key Novelty
Programmatic Code-based Data Synthesis & Two-Stage CoT-RL Training
- Generates training data by reversing the standard pipeline: uses LLMs to write code that plots charts from real tables, then synthesizes questions and step-by-step reasoning based on the code's ground truth
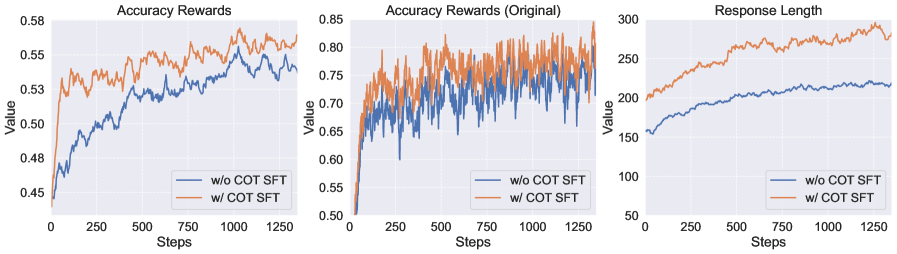
- Introduces a two-stage training strategy: Chart-COT (SFT on reasoning paths for cold start) followed by Chart-RFT (Reinforcement Learning with rule-based rewards for answer accuracy and formatting)
Architecture
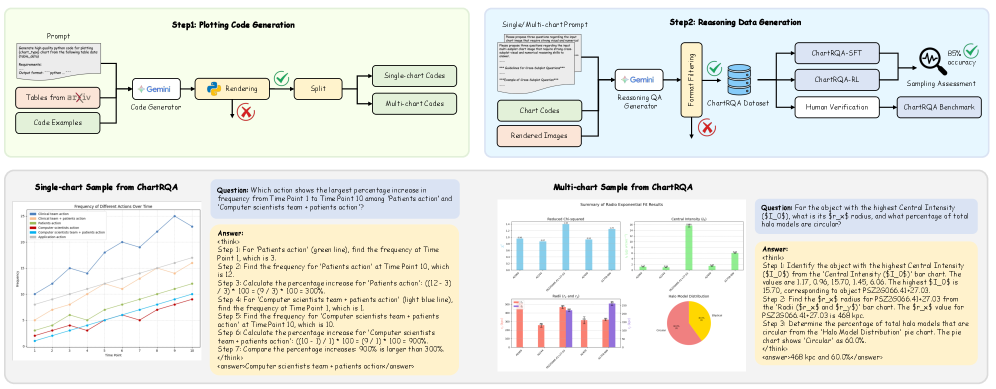
The data synthesis pipeline: From arXiv tables to Code Generation to Chart Rendering to Question/Answer Synthesis.
Evaluation Highlights
- Achieves 83.9% on ChartQA, surpassing GPT-4o (80.3%) and Claude-3.5-Sonnet (82.1%)
- Outperforms state-of-the-art chart models by ~20-30 points on the proposed ChartRQA-Multi benchmark (53.6% vs ChartReasoner's 20.3%)
- Sets new state-of-the-art for <20B parameter models across CharXiv-RQ, ChartMuseum, and ChartQA benchmarks
Breakthrough Assessment
8/10
Significantly advances chart reasoning by successfully applying the 'O1/DeepSeek-R1' style RL paradigm to the chart domain, supported by a novel high-fidelity data synthesis pipeline.